Into the Weeds of GRASS
NCSU GeoForAll Lab
at the
Center for Geospatial Analytics
NC State University

NC GIS 2025, March 19-21, 2025
Vaclav (Vashek) Petras
- Sr. Research Software Engineer at NC State's Center for Geospatial Analytics
- GRASS: Core Development Team, Project Steering Committee
- OSGeo: Charter Member, GRASS is an OSGeo Project


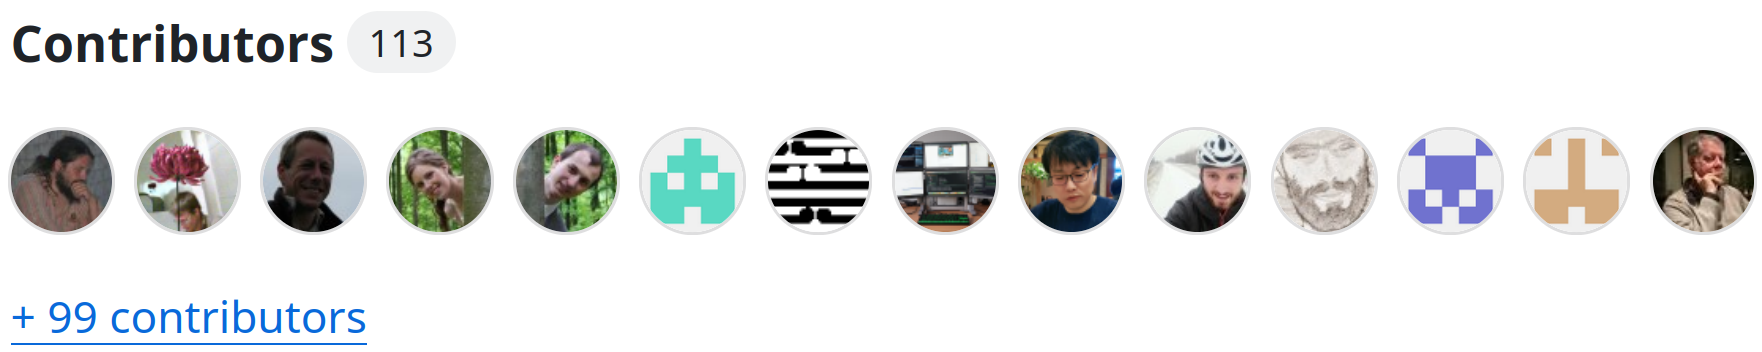
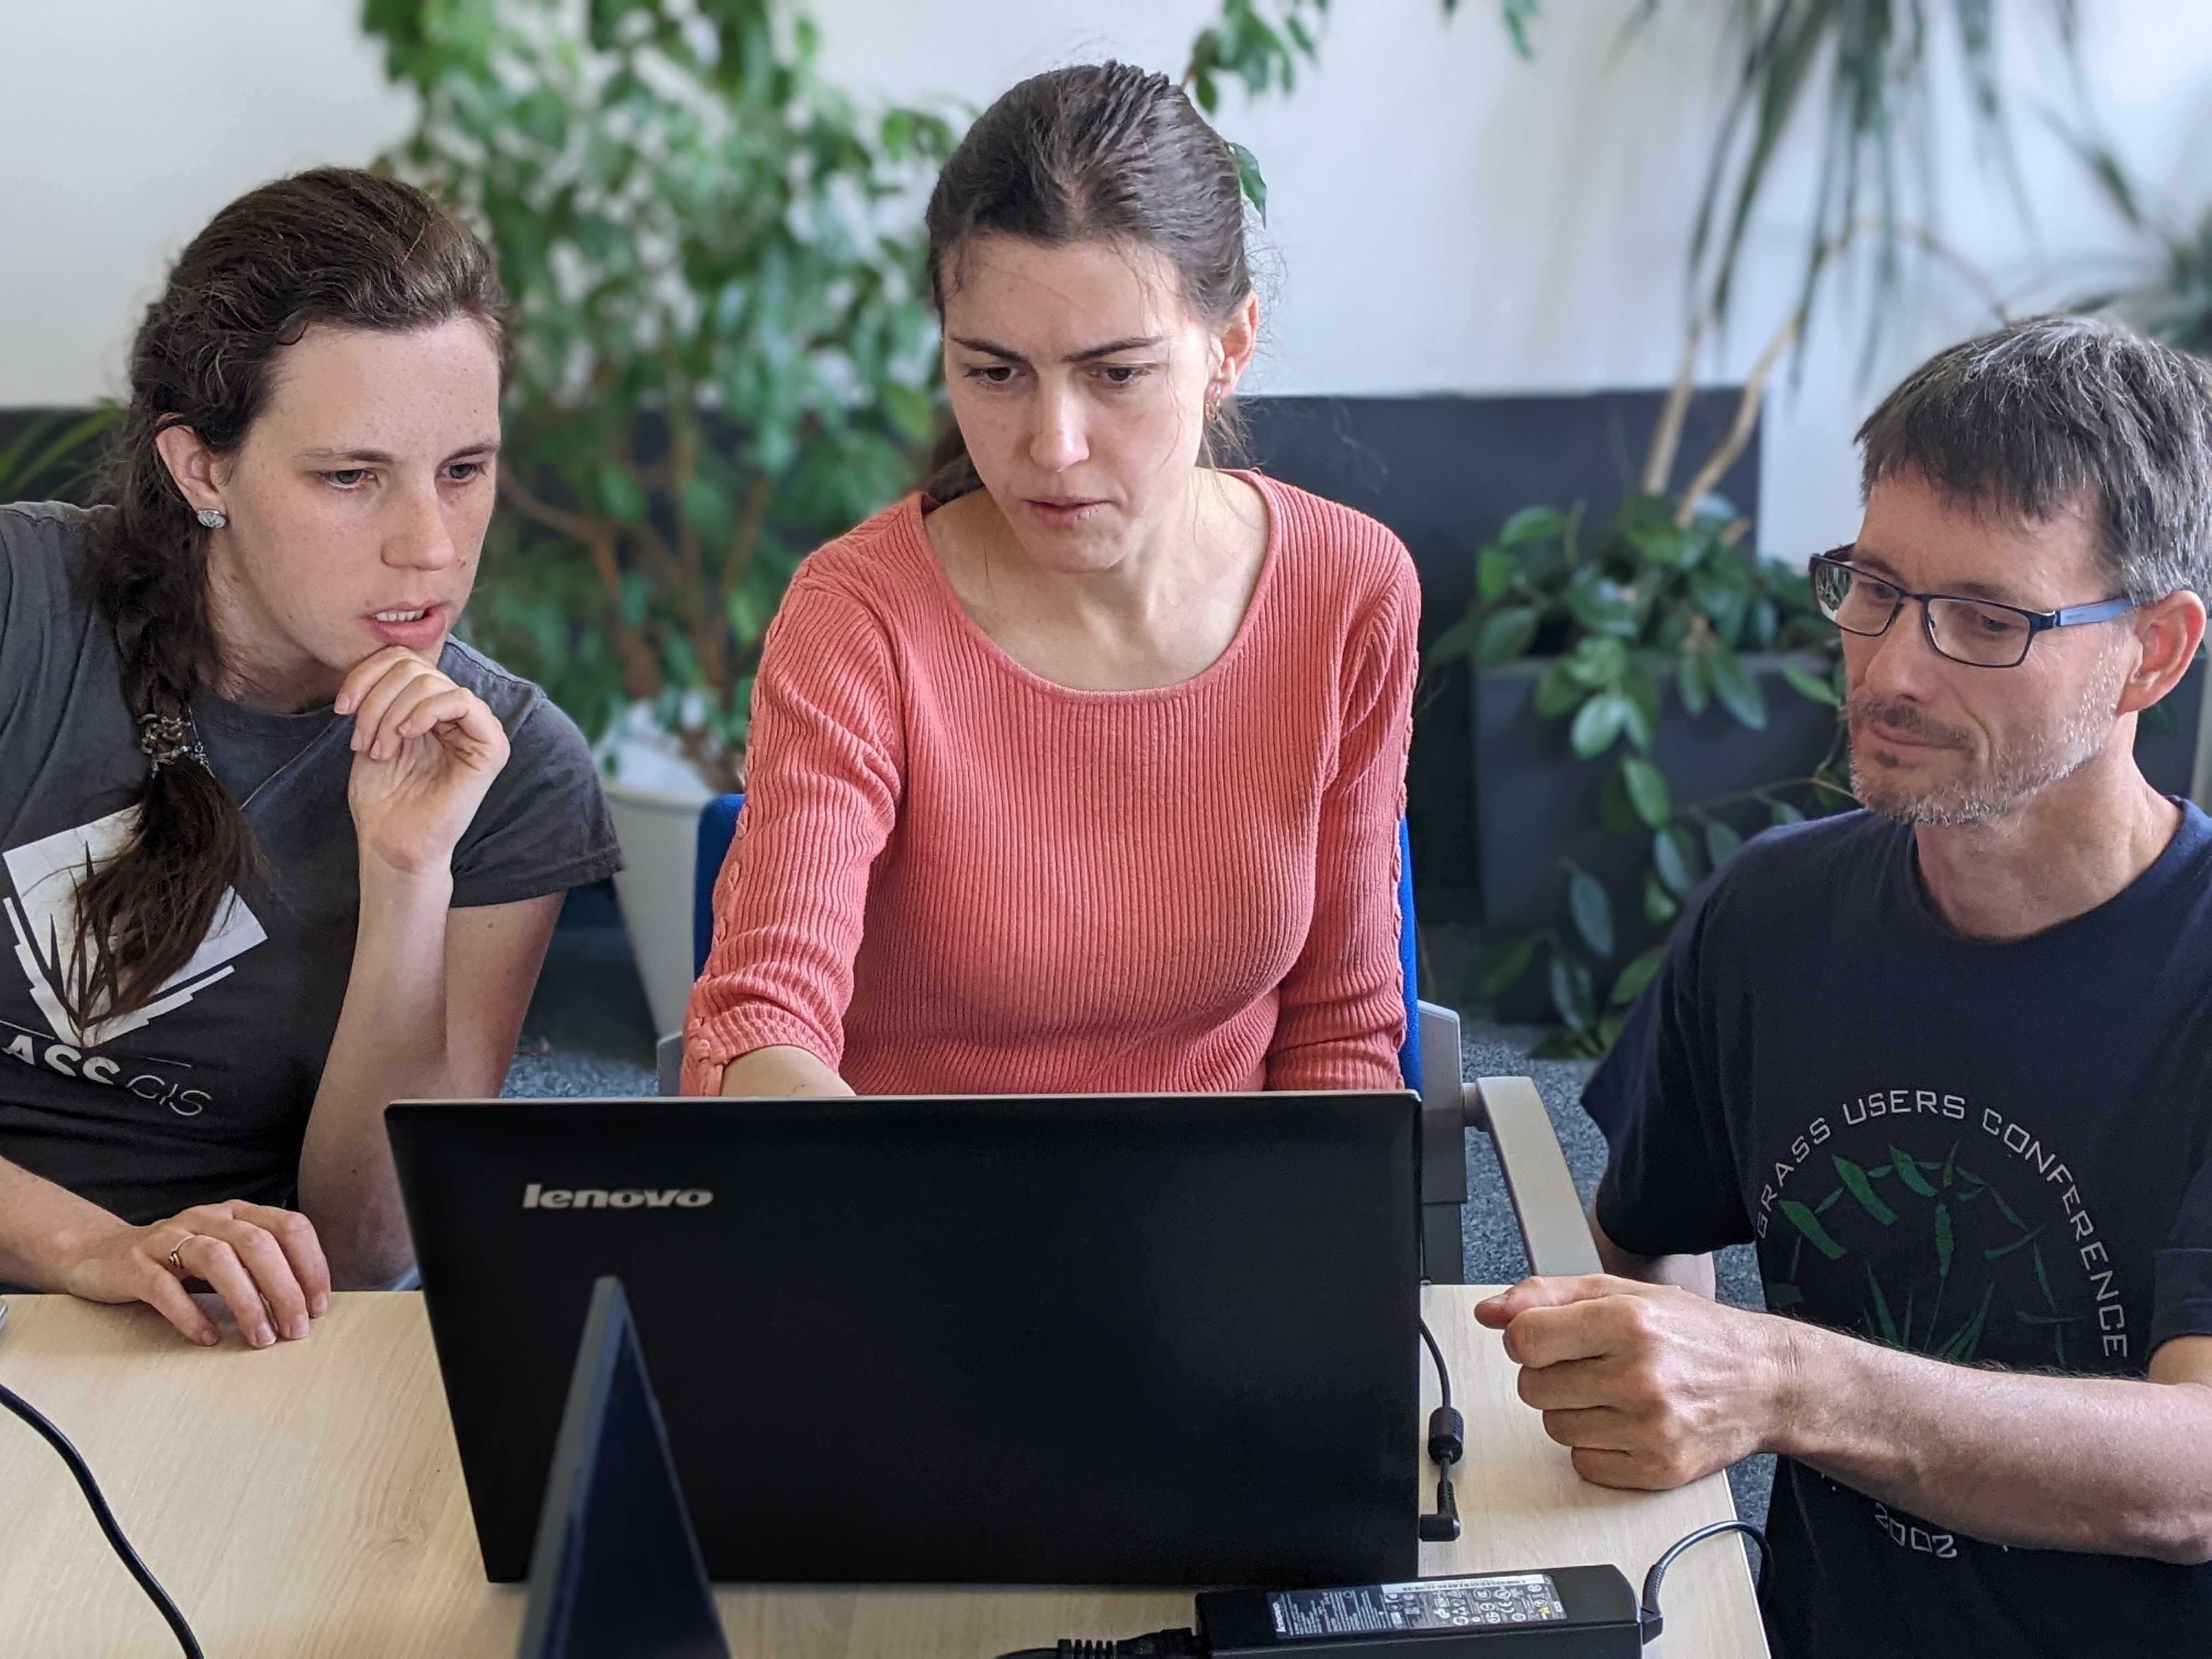
Community
Thanks to all those involved!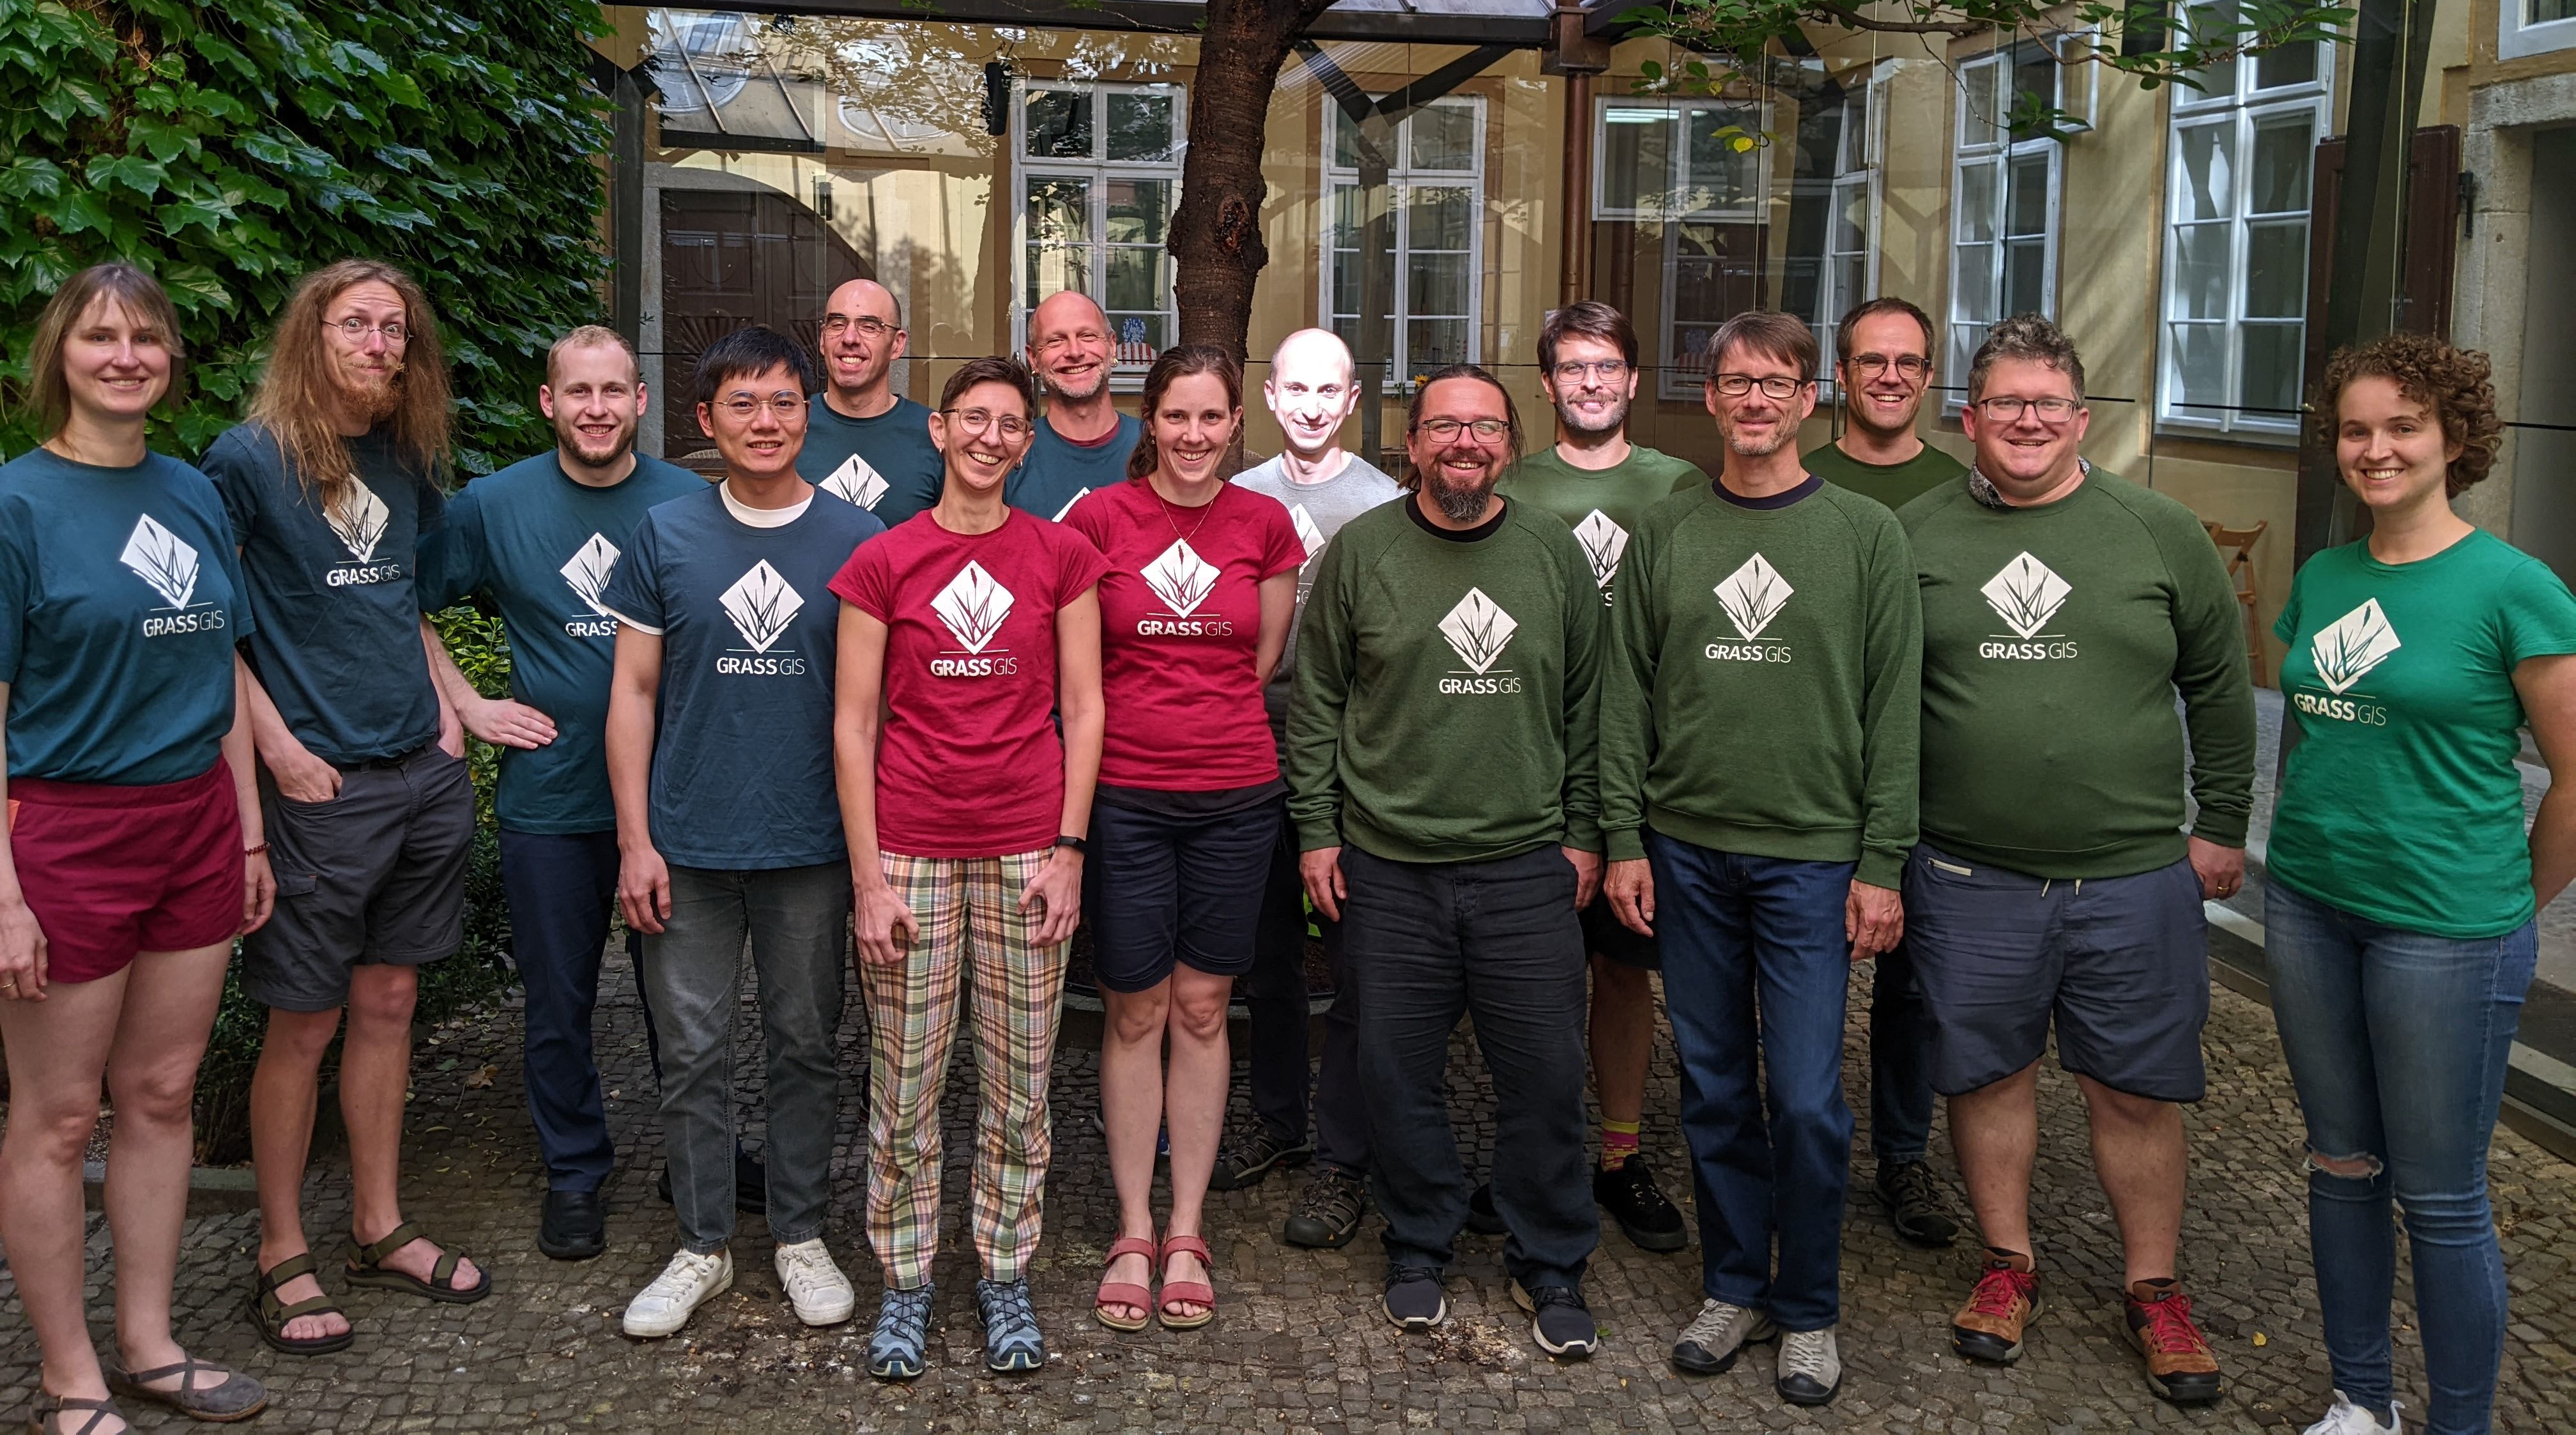
GRASS
- geospatial processing engine
- 400+ processing tools
- 400+ more tools in GRASS Addons
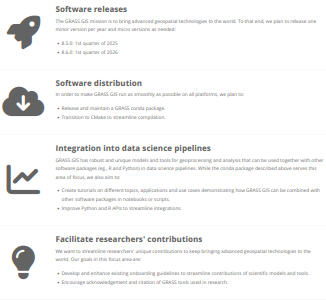
Releases
- 8.4.1, February 2025 Current version for everyday user
- 8.5.0 Preview, Daily Latest reviewed functional code
- 7.8.8 Legacy, August 2023 Maintained legacy version for some production systems
New in 8.4 comparing to 8.3
Tools: More Machine Learning
Supervised classification with Support Vector Machines
- i.svm.train: Train a Support Vector Machine
- i.svm.predict: Predict with a Support Vector Machine
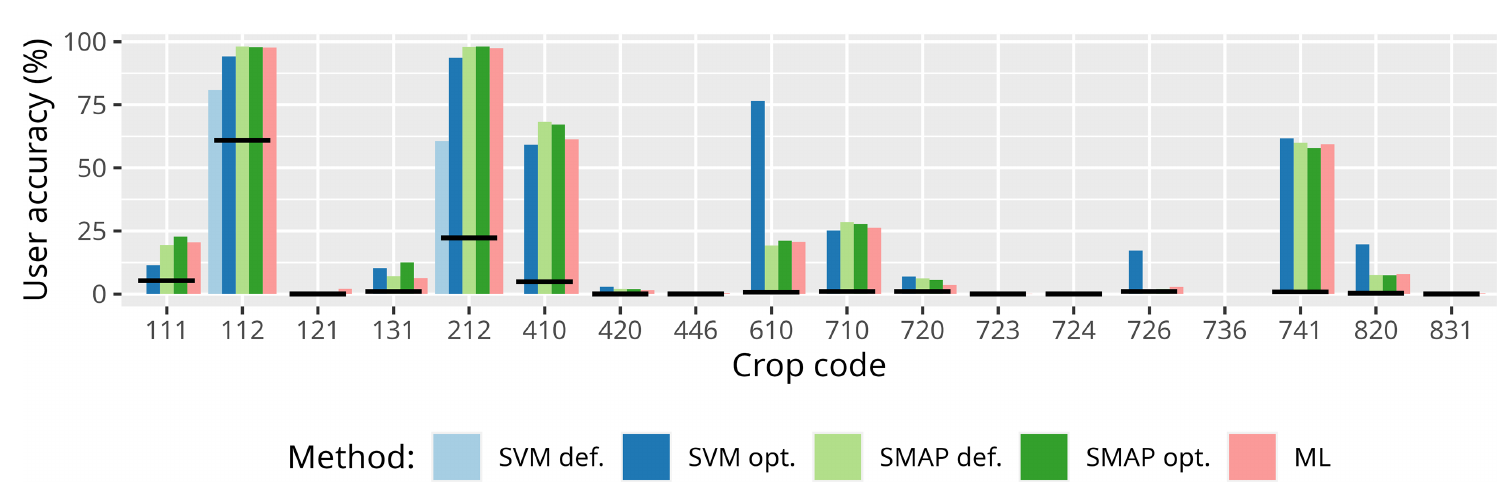 by Maris Nartiss (Nartiss & Melniks 2023)
Tools: More Topology Handling
v.fill.holes: Fill holes in areas by keeping only outer boundaries
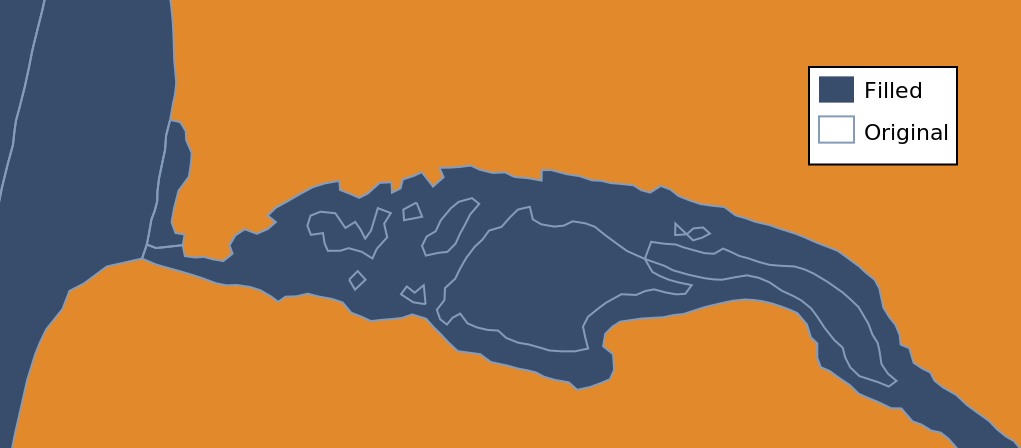 by Vaclav Petras
Tools: Better Horizon Identification
r.horizon: Output for multiple points, distances, and many other improvements
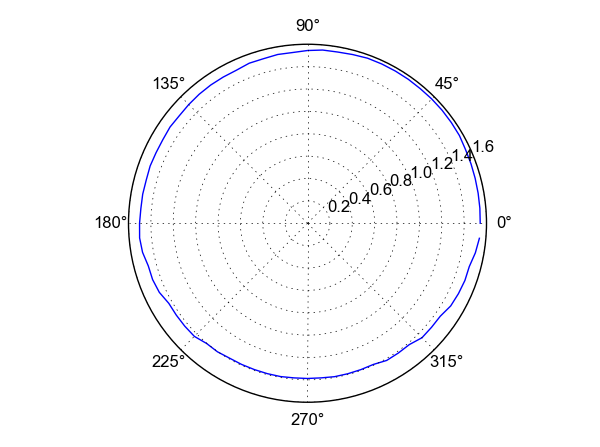 by Anna Petrasova, funded by NSF Award #2322073, granted to Natrx, Inc.
Interfaces: JSON for Text Outputs
JSON output format support(format="json") in multiple tools (v.db.select, t.rast.list, …)
v.db.select roadsmajor format=json
With better integration in Python:
        import json
        import grass.script as gs

        data = gs.parse_command("v.db.select", map="roadsmajor", format="json")
        for row in data["records"]:
            print(row["ROAD_NAME"])
More coming in 8.5 (r.report, r.info, …)
by Anna Petrasova, Vaclav Petras, Huidae Cho, Kriti Birda, Corey White, and othersLocations are now Projects
The Python API, command line, and GUI are now using project instead of location for the main component of the data hierarchy.
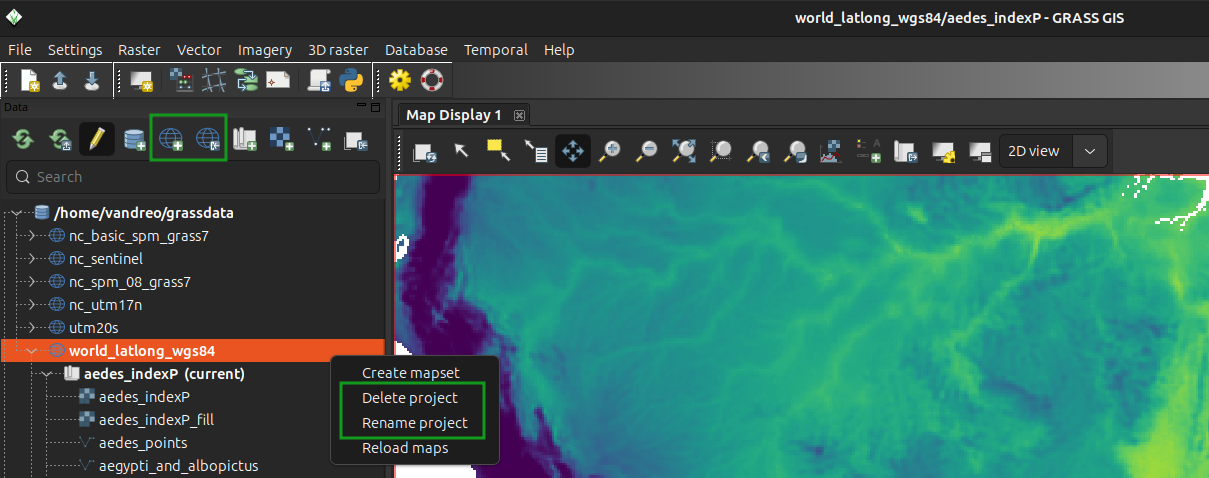
-
.../data/missouri(location → project)interstate_44(mapset aka sub-project)
Projects
-
Projects keep the data consistent.
- Same format for all data.
- Same CRS for all data.
- Separates data preprocessing from analysis.
-
Mapsets keep the data organized.
- One default mapset or multiple mapsets.
- Work is happening in one mapset, but data from any mapset can be used.
        import grass.script as gs

        gs.create_project("/path/to/project", epsg="3358")
-
.../data/missouri(project)interstate_44(mapset)- ...
Python API: Simpler Creation of Projects
grass.script Python package:
Greatly simplified the creation of new projects in Python without a running session (no more chicken and egg problems)
        import grass.script as gs

        gs.create_project("cordoba_utm21s", epsg="32721")
        gs.setup.init("cordoba_utm21s")
CLI: --tmp-project with --exec
--tmp-location is now --tmp-project
grass --tmp-project EPSG:3358 --exec \
    r.viewshed input=elevation \
    output=viewshed coordinates=642964,222890
--tmp-location continues to work
Long-term view
Carrier Investment
- Invest your time into technologies which stay and don't disapear in couple years.
- Bash scripting, Python, GRASS
- Longetivity, open-source, platfrom-idependent
- Things develop, versions update, features are added...
- ...but general ideas stay the same.
Code from 2002 running in 2019?
version 5.0 code works as is in 7.6:r.mapcalc depr.bin="if((elev - fill)< 0., 1, 0)"
although there is a better way to write it:
r.mapcalc "depr_bin = if((elev - fill) < 0., 1, 0)"

Open-Source Licensing
-
Organizations:
- Provider-independent, contractor-independent.
- Financial investments go to a public pool.
- Pay for support and features, not usage.
- No per-CPU license fees.
-
Individuals:
- Work computer or personal laptop.
- Employer-independent.
More New Features 8.4
Python API: Animations and ipyleaflet
grass.jupyter Python package:
-
New
grass.jupyter.SeriesMapclass for animating series of vectors or rasters (temporal animations already available) - New option to create a maps with ipyleaflet (will bring interactivity in 8.5)
s = gj.SeriesMap(height = 500)
s.add_rasters(["elevation_shade", "geology", "soils"])
s.add_vectors(["streams", "streets", "viewpoints"])
s.d_barscale()
s.show()
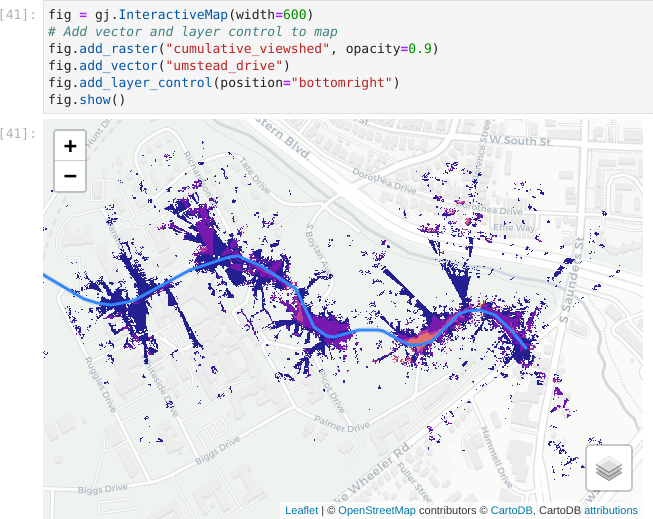
m = InteractiveMap(map_backend="ipyleaflet")
m.add_vector("streams")
m.add_raster("elevation")
m.show()
GUI: New History Browser Panel
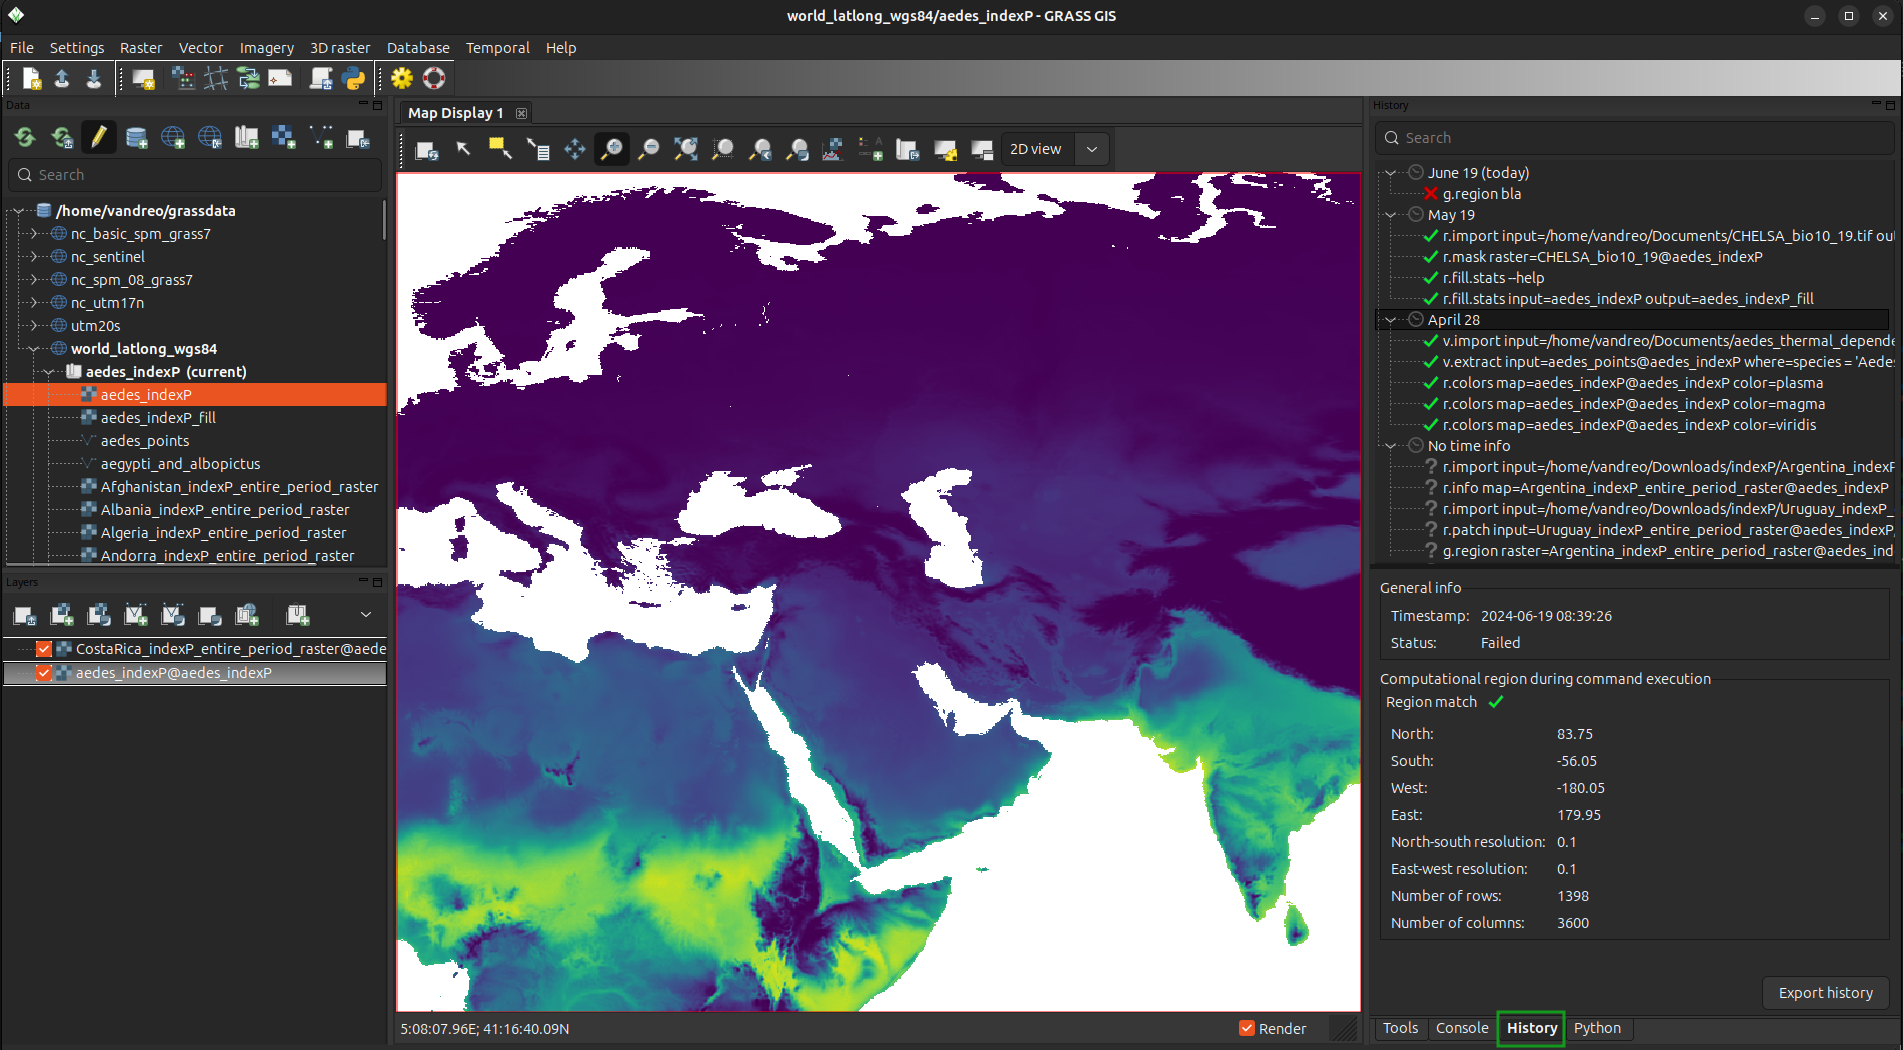 by Linda Karlovska with a GRASS Student Grant
Addon Tools: Wind-water Interactions
r.windfetch – distance which winds blow without obstruction
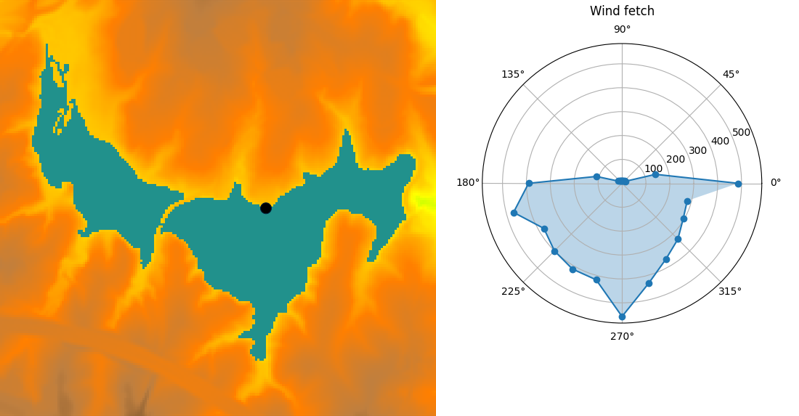
by Anna Petrasova, funded by NSF Award #2322073, granted to Natrx, Inc.
Addon Tools: Digest Data with EODAG
download, import, preprocessing, cloud detection, and masking of remote sensing data with EODAG (Earth Observation Data Access Gateway)
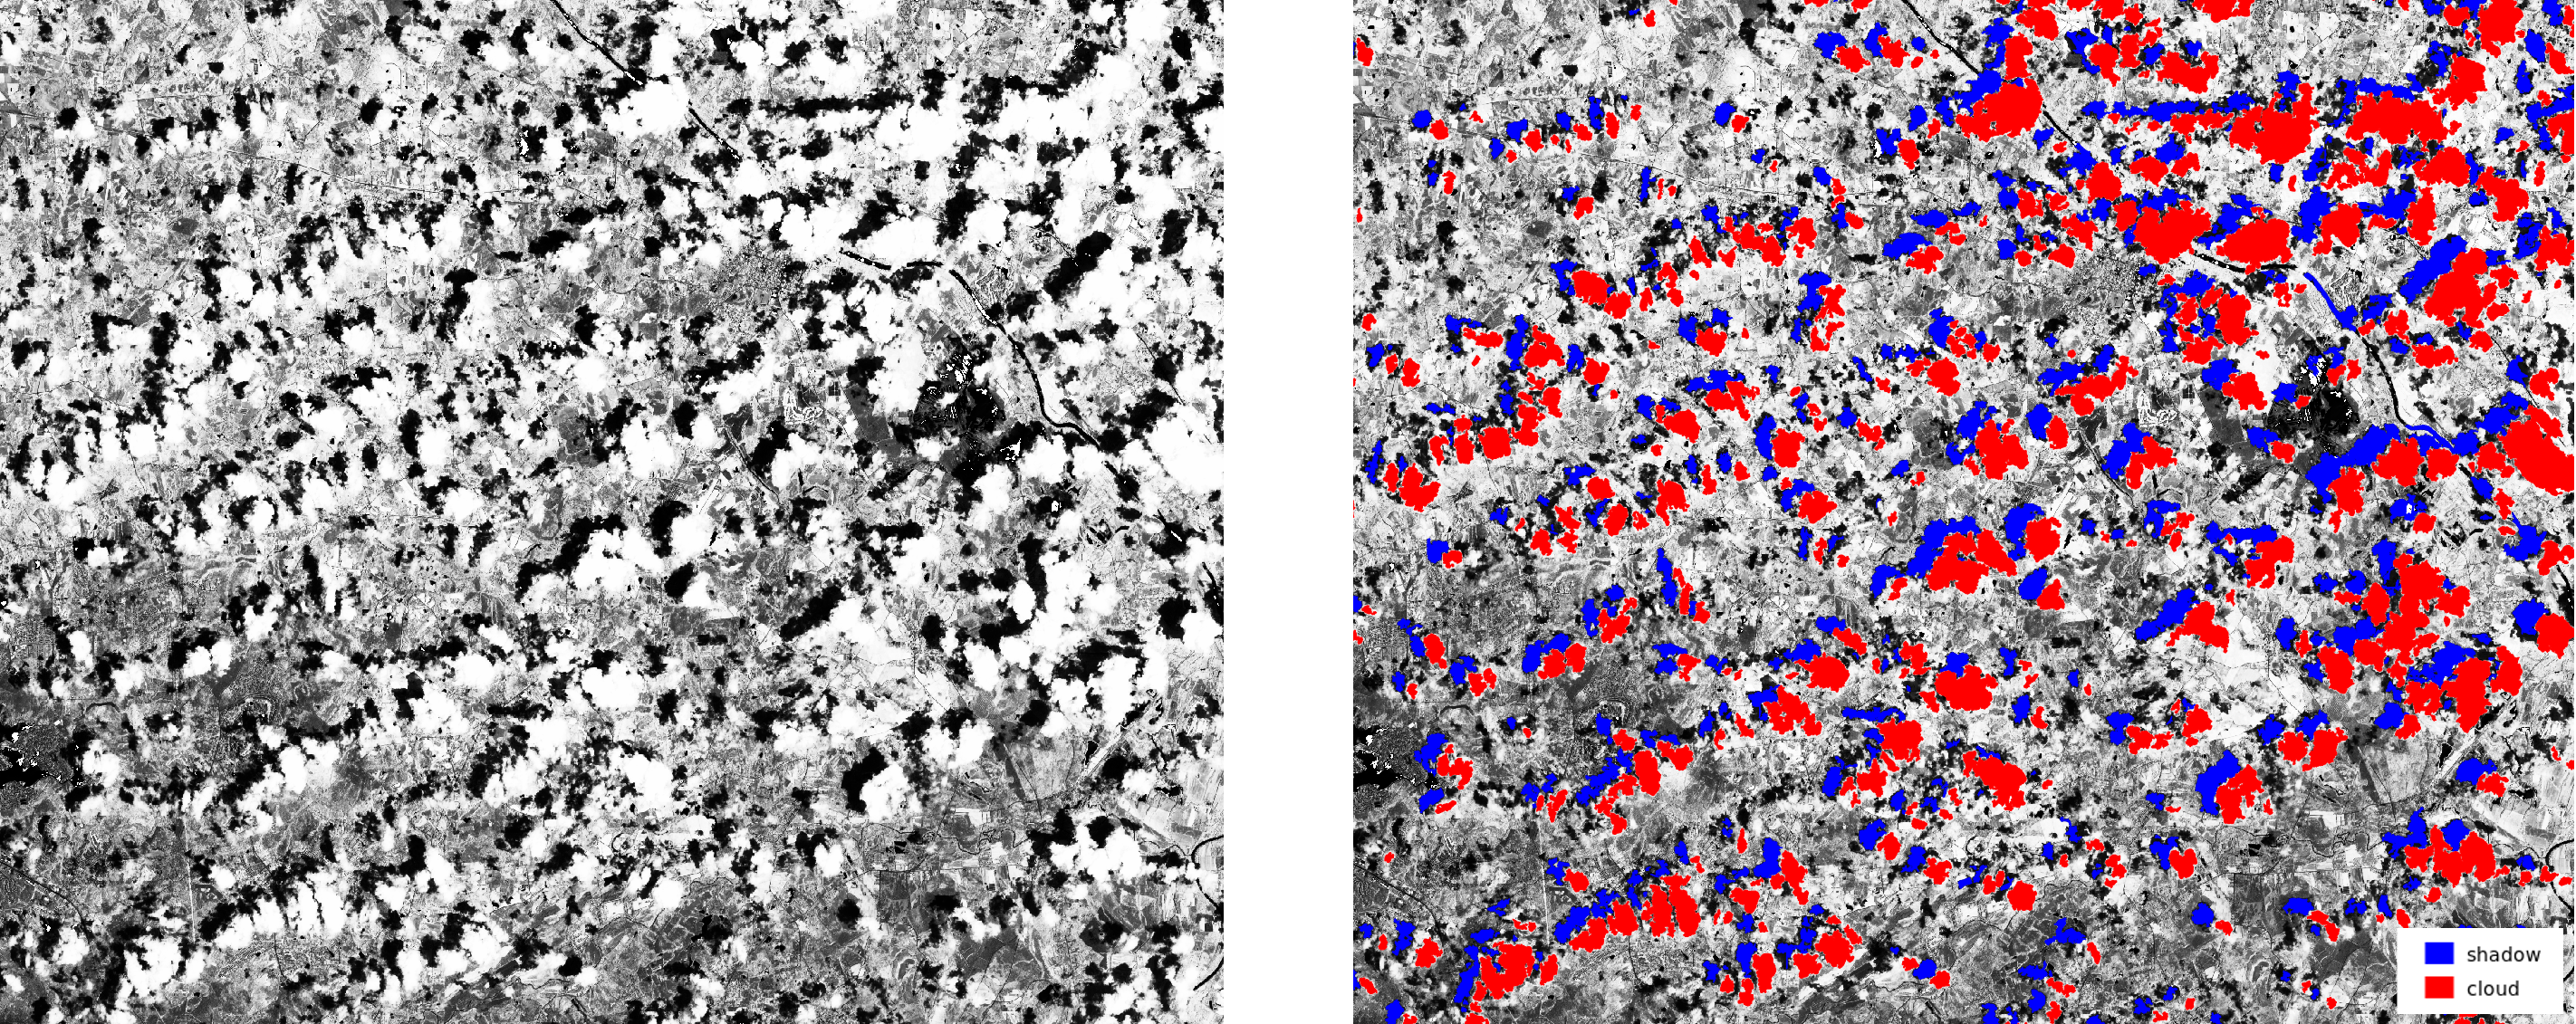
by Hamed A. Elgizery, Veronica Andreo, Stefan Blumentrath
More Features
Tools: Temporal Algebra
D = if(start_date(A) < "2005-01-01", A + B)
Sum maps from A with maps with equal time stamps from B which are temporally before Jan 1, 2005
by Thomas Leppelt and Soeren Gebbert
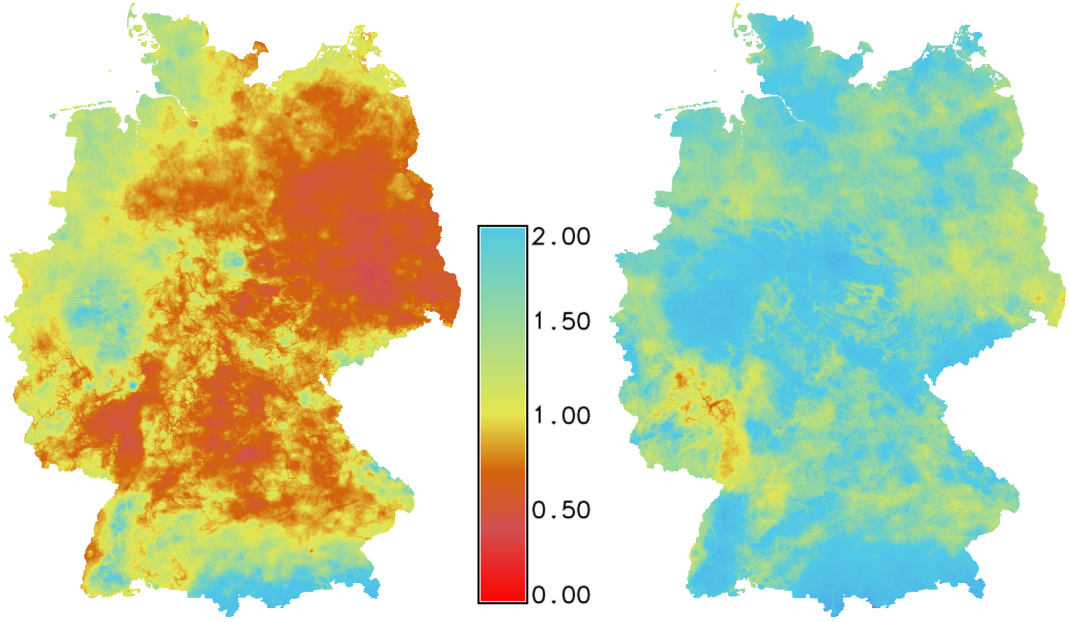
Tools: Skyview
r.skyview – non-directional alternative to shaded relief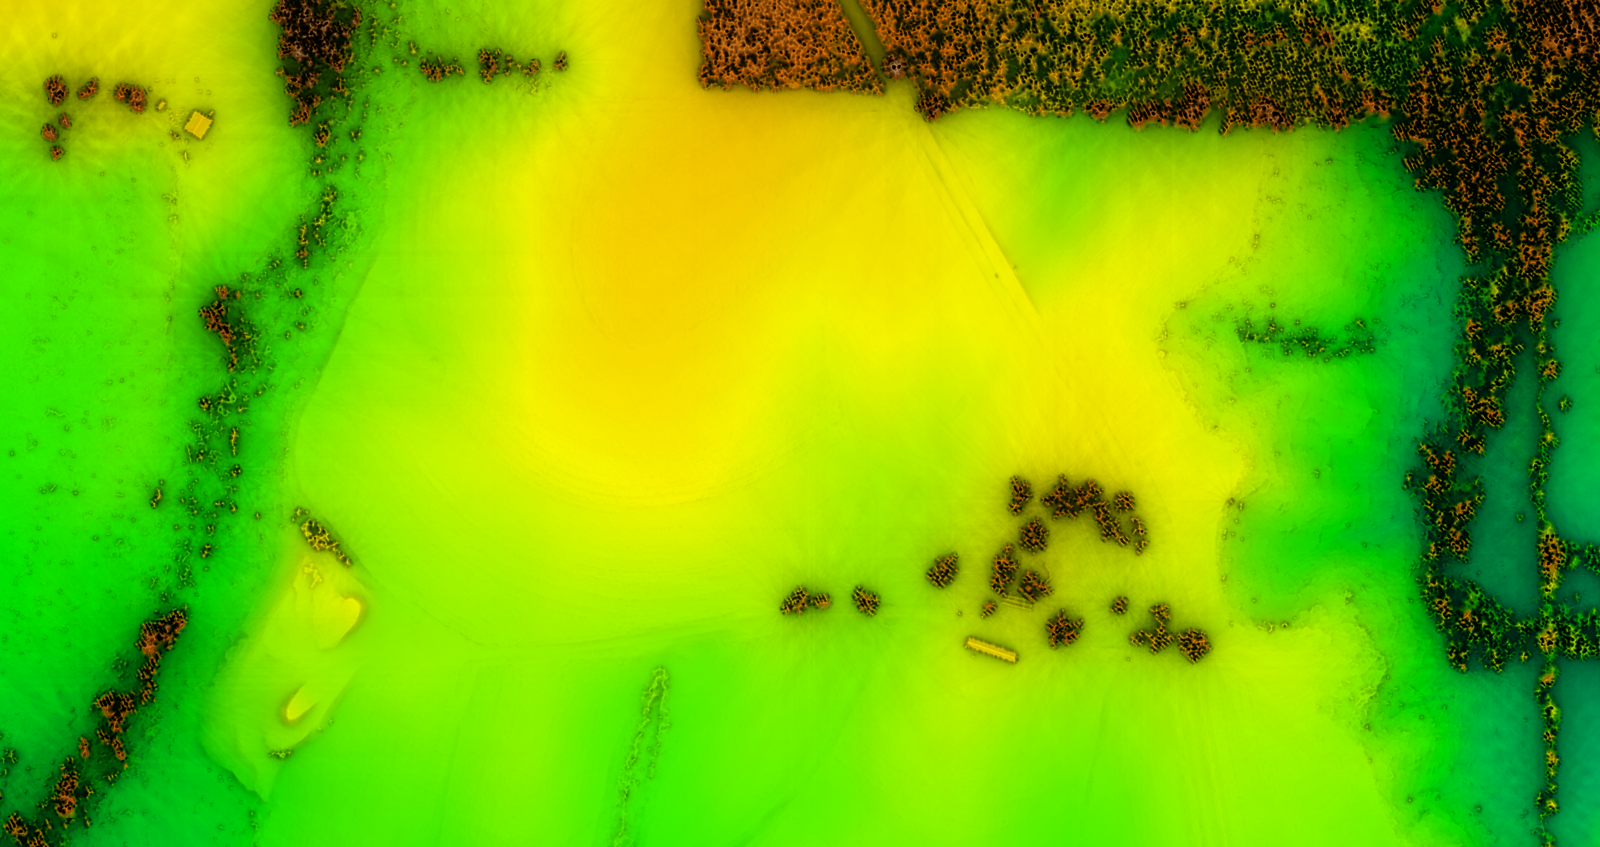
by Anna Petrasova
Tools: SLIC
i.superpixels.slic - image segmentation using SLIC superpixels
by Rashad Kanavath and Markus Metz
Tools: Fast Hydrology Algorithms
r.accumulate – fast weighted flow accumulation, watersheds, stream networks, and longest flow paths using a flow direction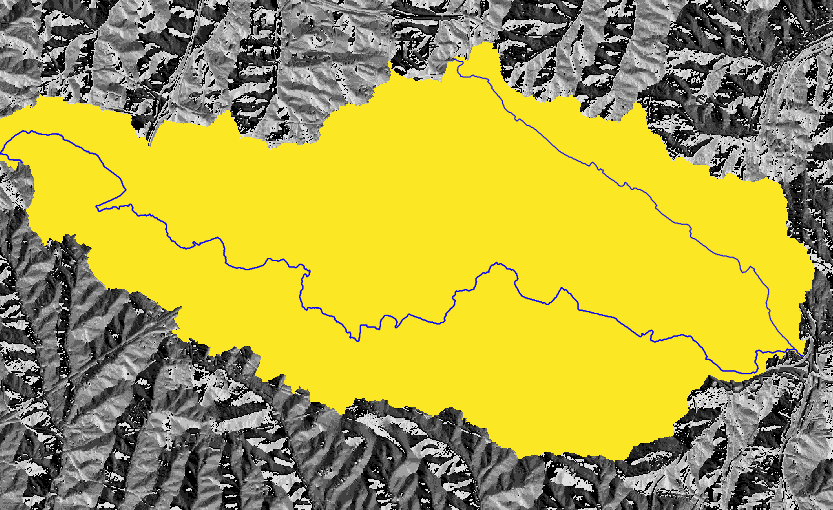
by Huidae Cho
Tools: Vector Topology Cleaning
v.clean – automated topology with outputs for additional checks
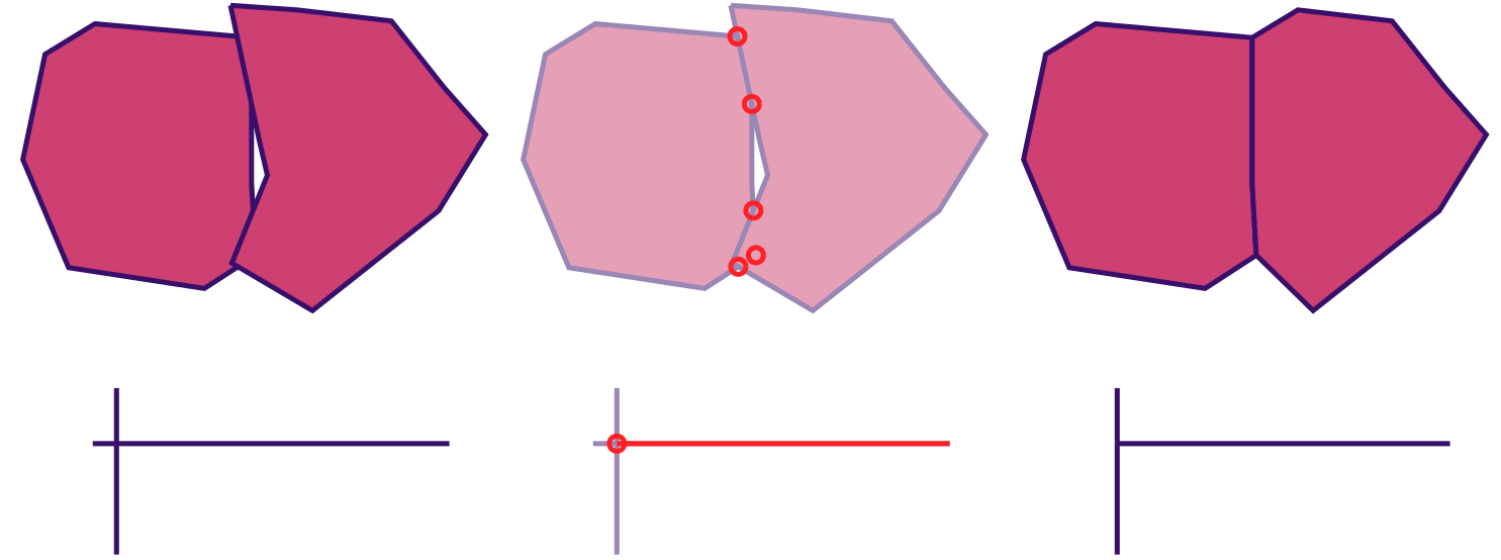
by Markus Metz, Radim Blazek, and others
Tools: Urban Modeling
r.futures - set of tools for urban growth modeling
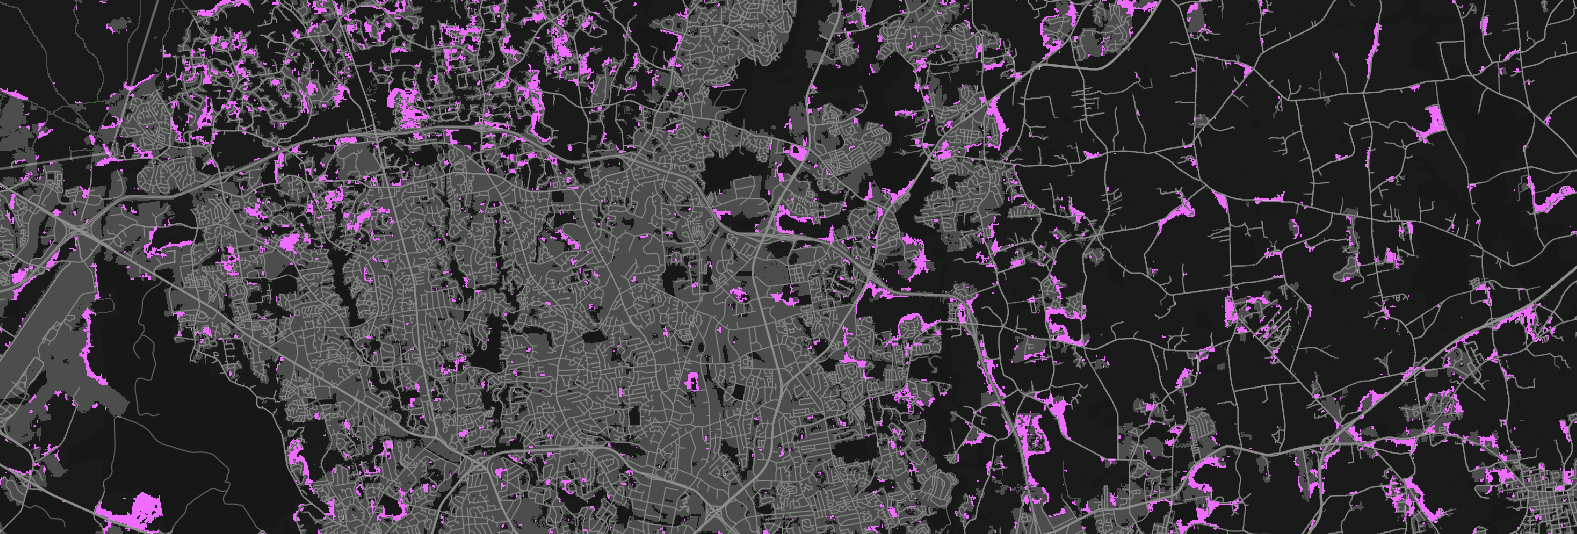
by NC State Center for Geospatial Analytics
Community and Project Maintenance
Project Roadmap
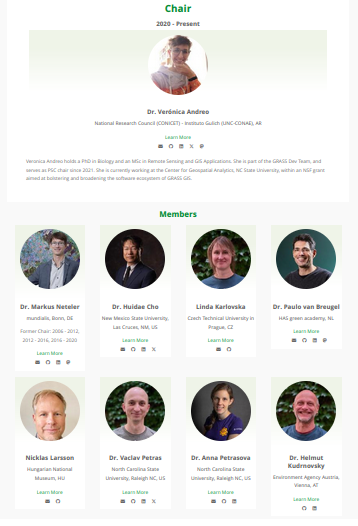
Project Steering Committee Elections
- Elections: October 2024, Positions Filled: 4
- Total Members: 9, Term Length: 6 years
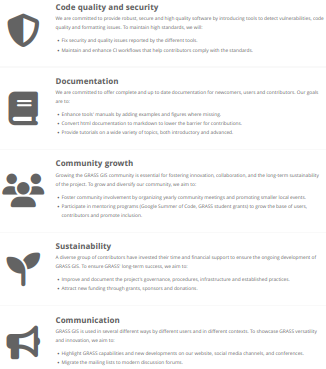
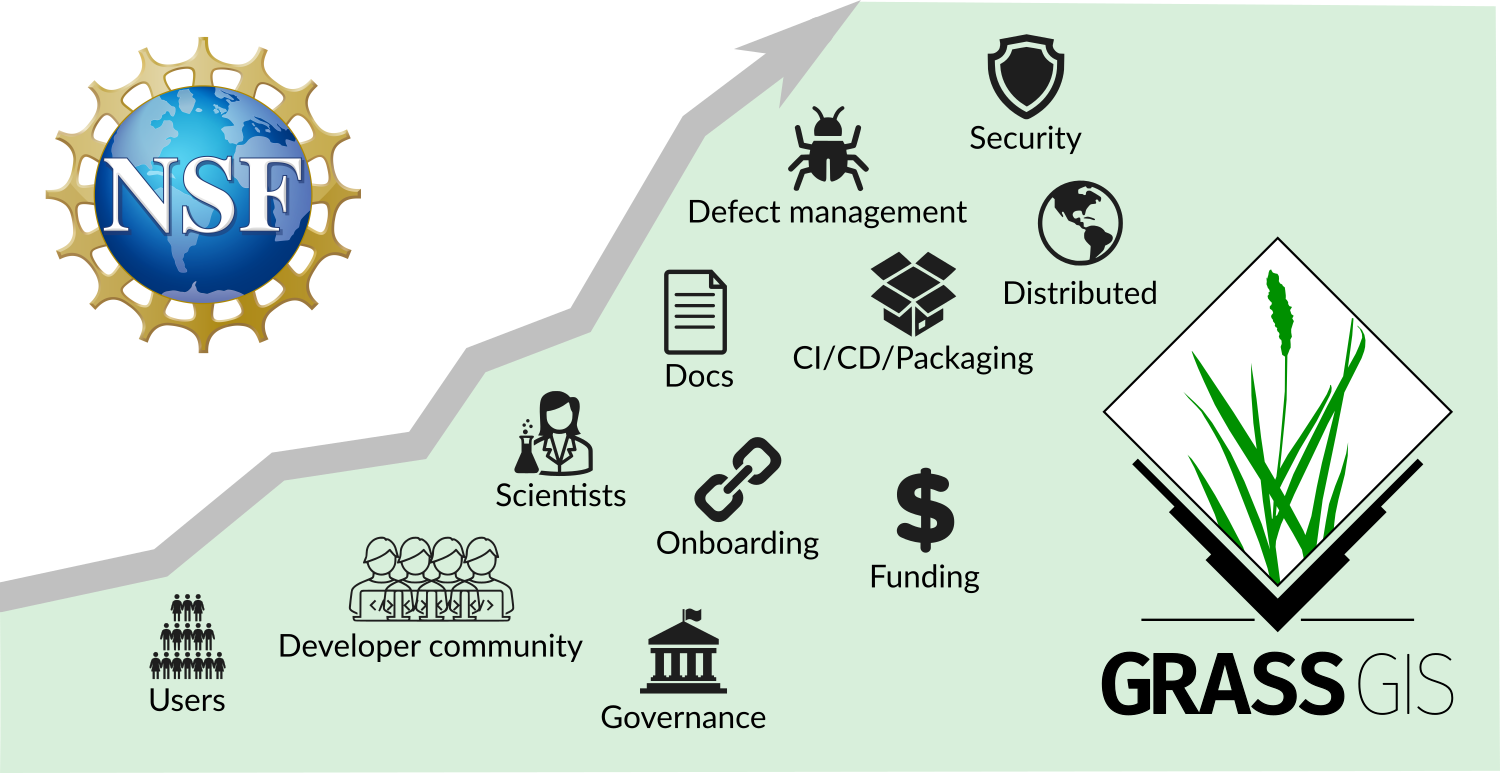
NSF Grant Lead by NC State
-
NSF grant awarded to NC State, ASU, NMSU, Yale
- To enhance infrastructure
- To revise contributing guidelines
- To support community building
- The NSF program is not funding new features, bug fixes, or ongoing maintenance
Financial Contributions
- Contributions through Open Collective partially support face-to-face meetings and student grants.
- We would like to finance ongoing maintenance.
- Talk to me if Open Collective does not work for you.

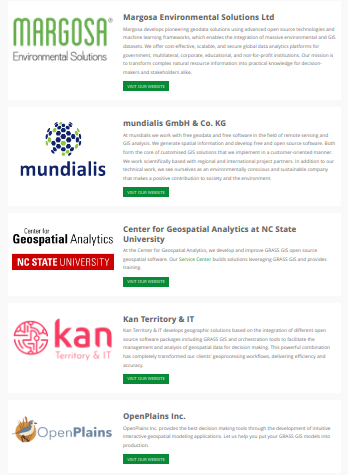
Commercial Support
New Tutorials Site
Just launched: grass-tutorials.osgeo.org
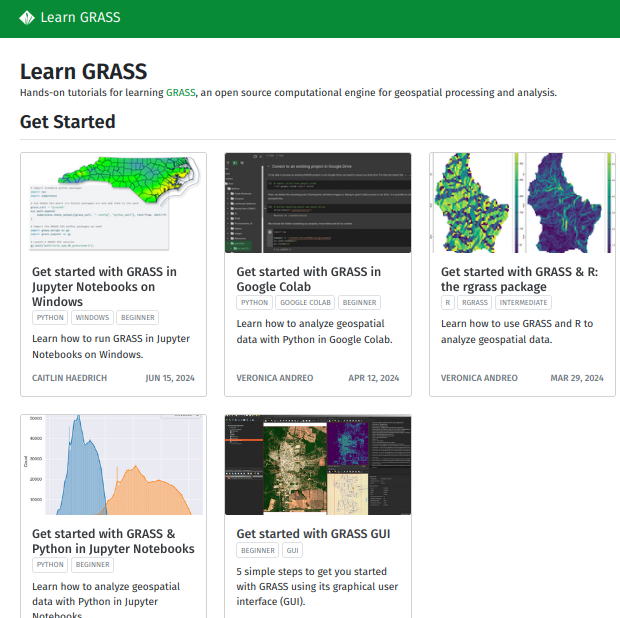
lead by the NC State Center for Geospatial Analytics
New Documentation
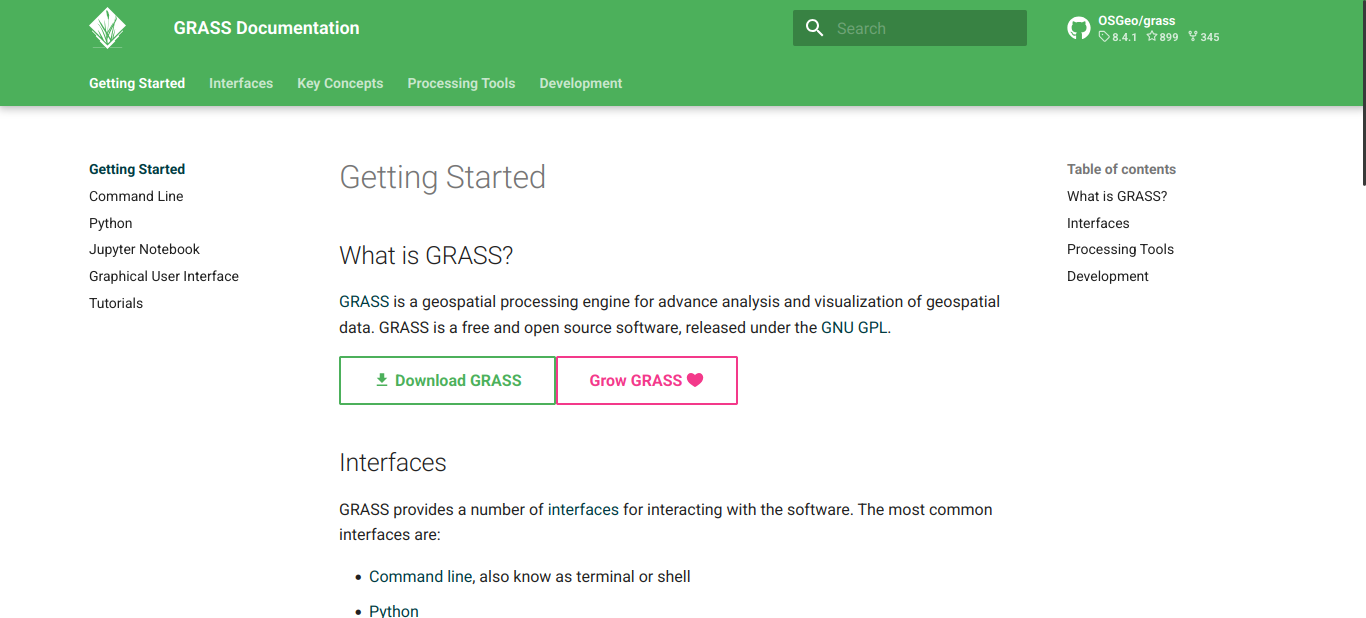
lead by the NC State Center for Geospatial Analytics
Swag Shop
or search for "grass project shop" on Redbubble
lead by the NC State Center for Geospatial Analytics
Re-adopting the Classic Name
Since GRASS is doing more in geospatial than just GIS, we are re-adopting GRASS instead of GRASS GIS.
GRASS
Lead by the NC State Center for Geospatial Analytics
& Approved by the Project Steering Committee in February
New Logo & Branding
In a testing phase and under the Project Steering Committee approval process
lead by the NC State Center for Geospatial Analytics
Mentoring and Student Grants Program
- Mentoring to integrate GRASS into your workflows (registration closes in May)
- Student grants to contribute to GRASS (call open for 2025)
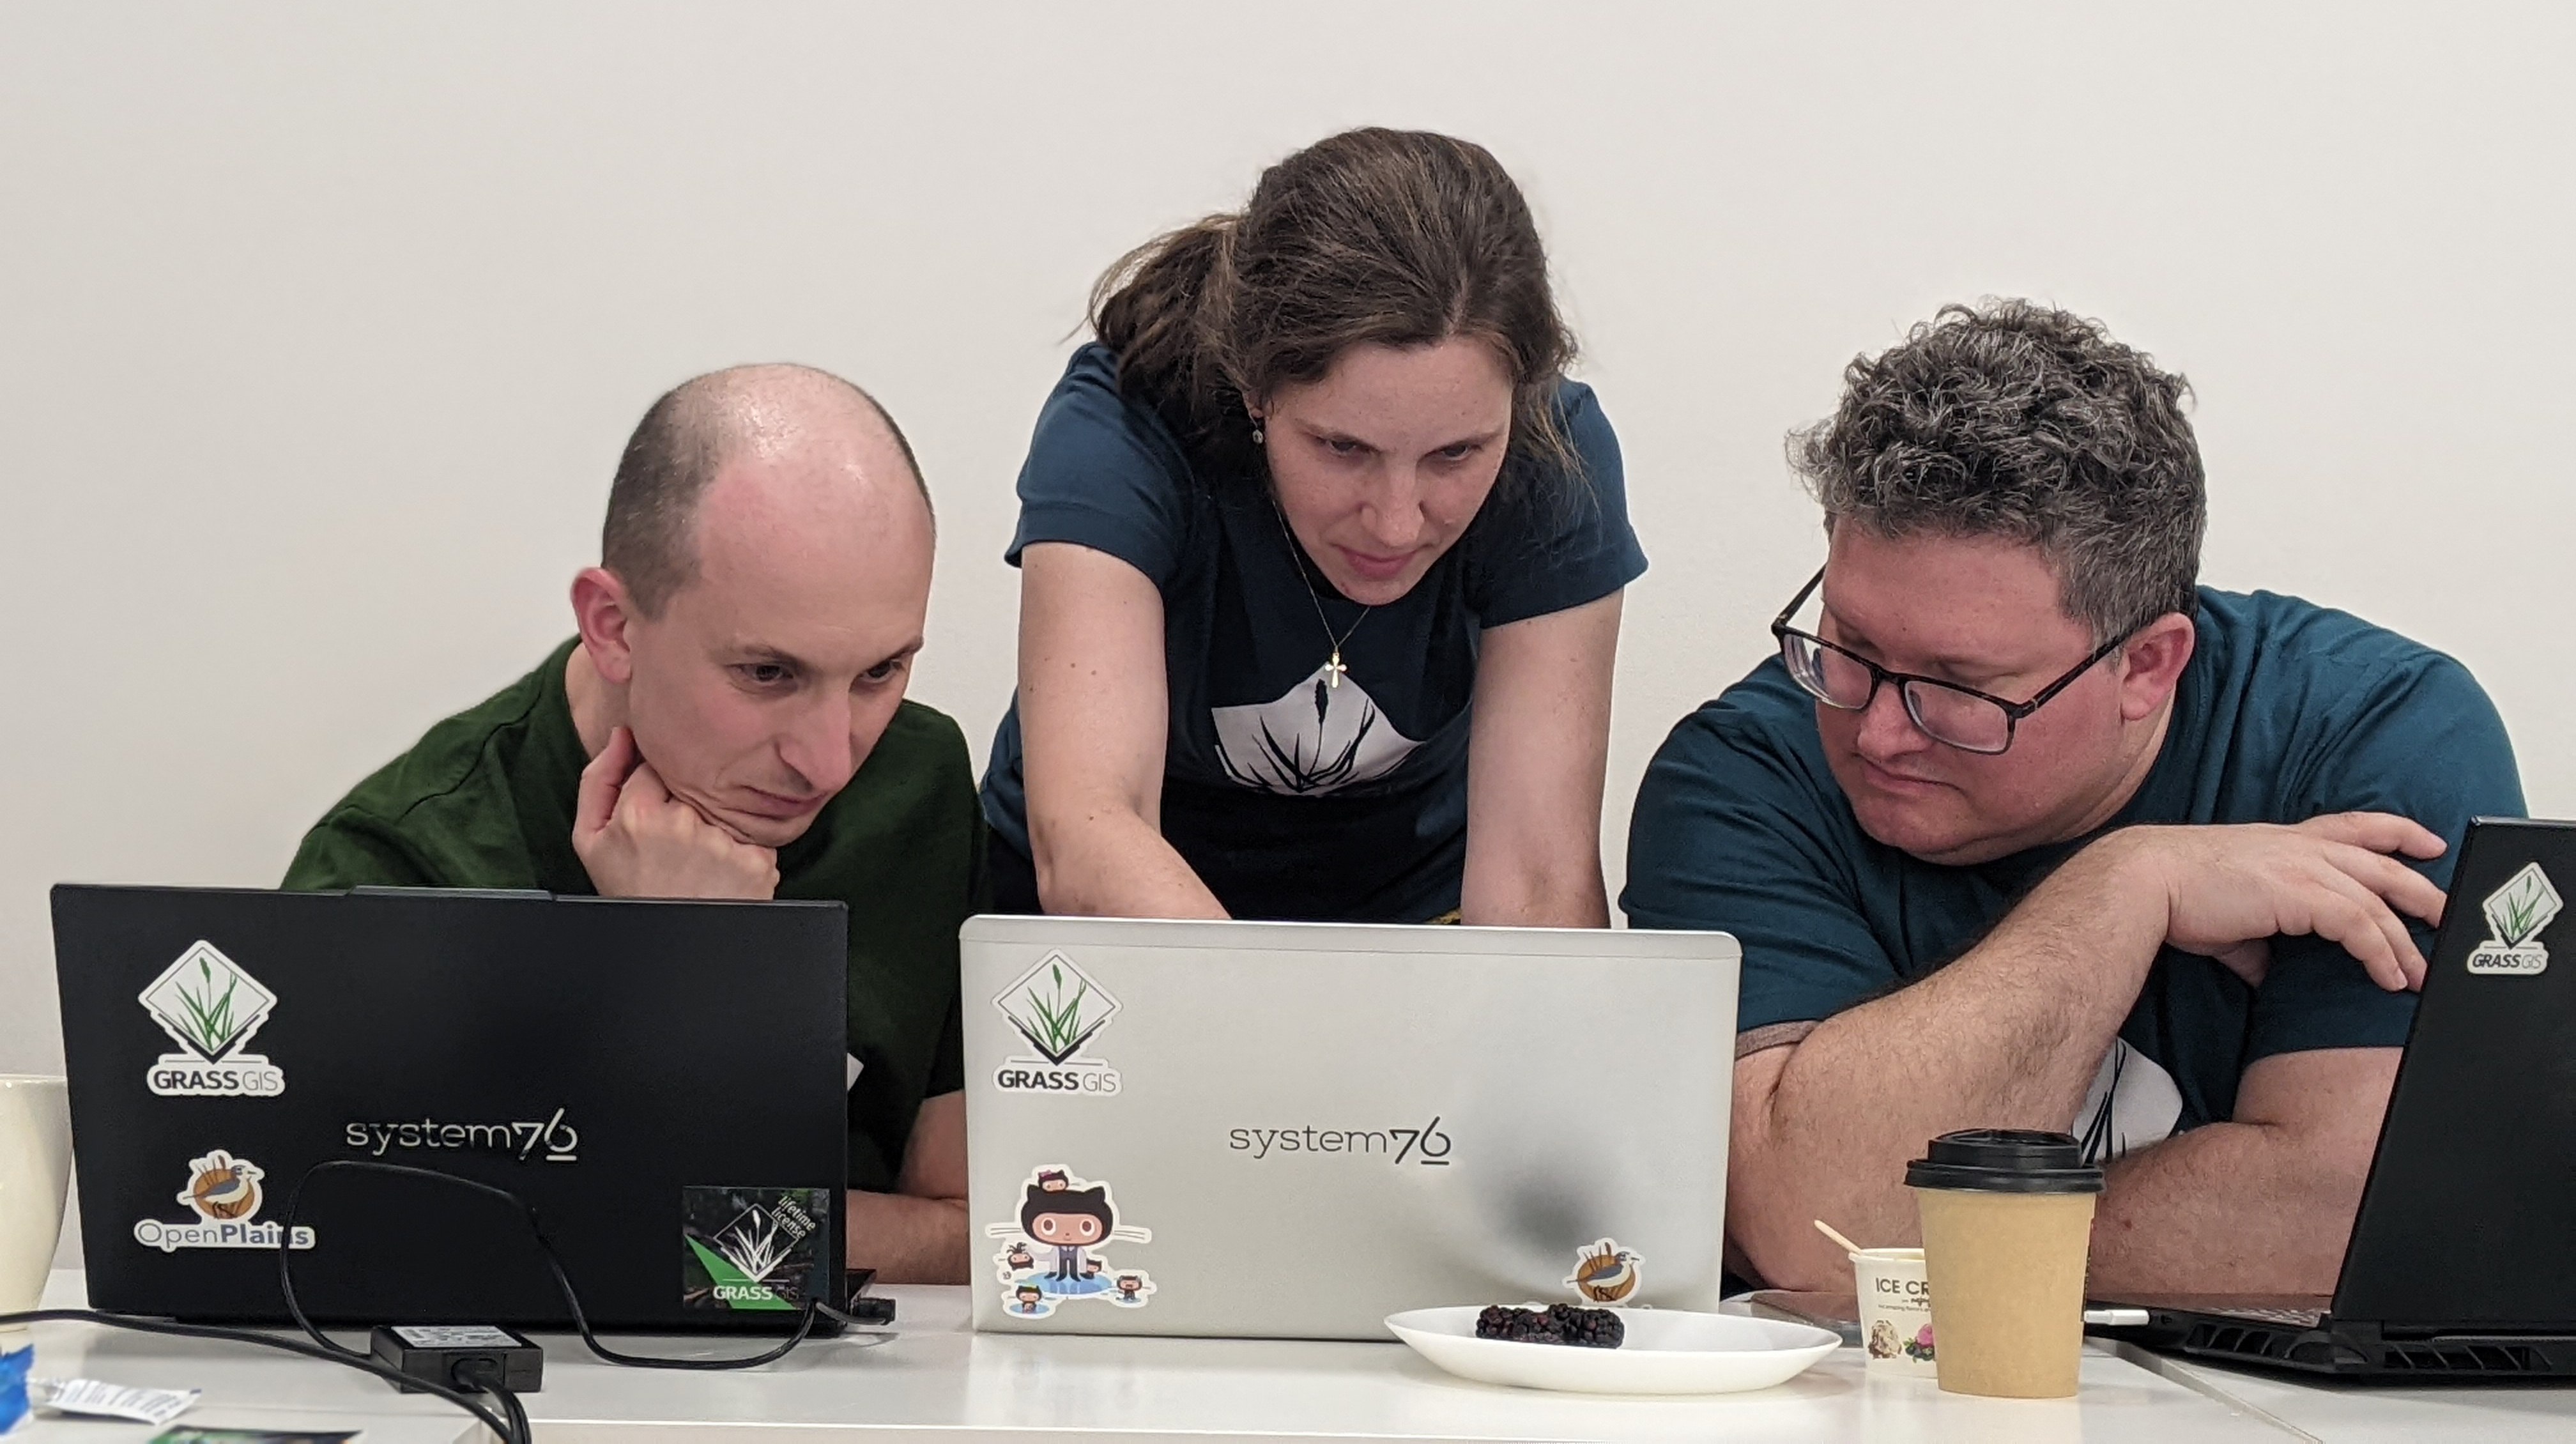
Community Meeting 2024
12-hour work days, 8.4.0 release, CI, parallelization, …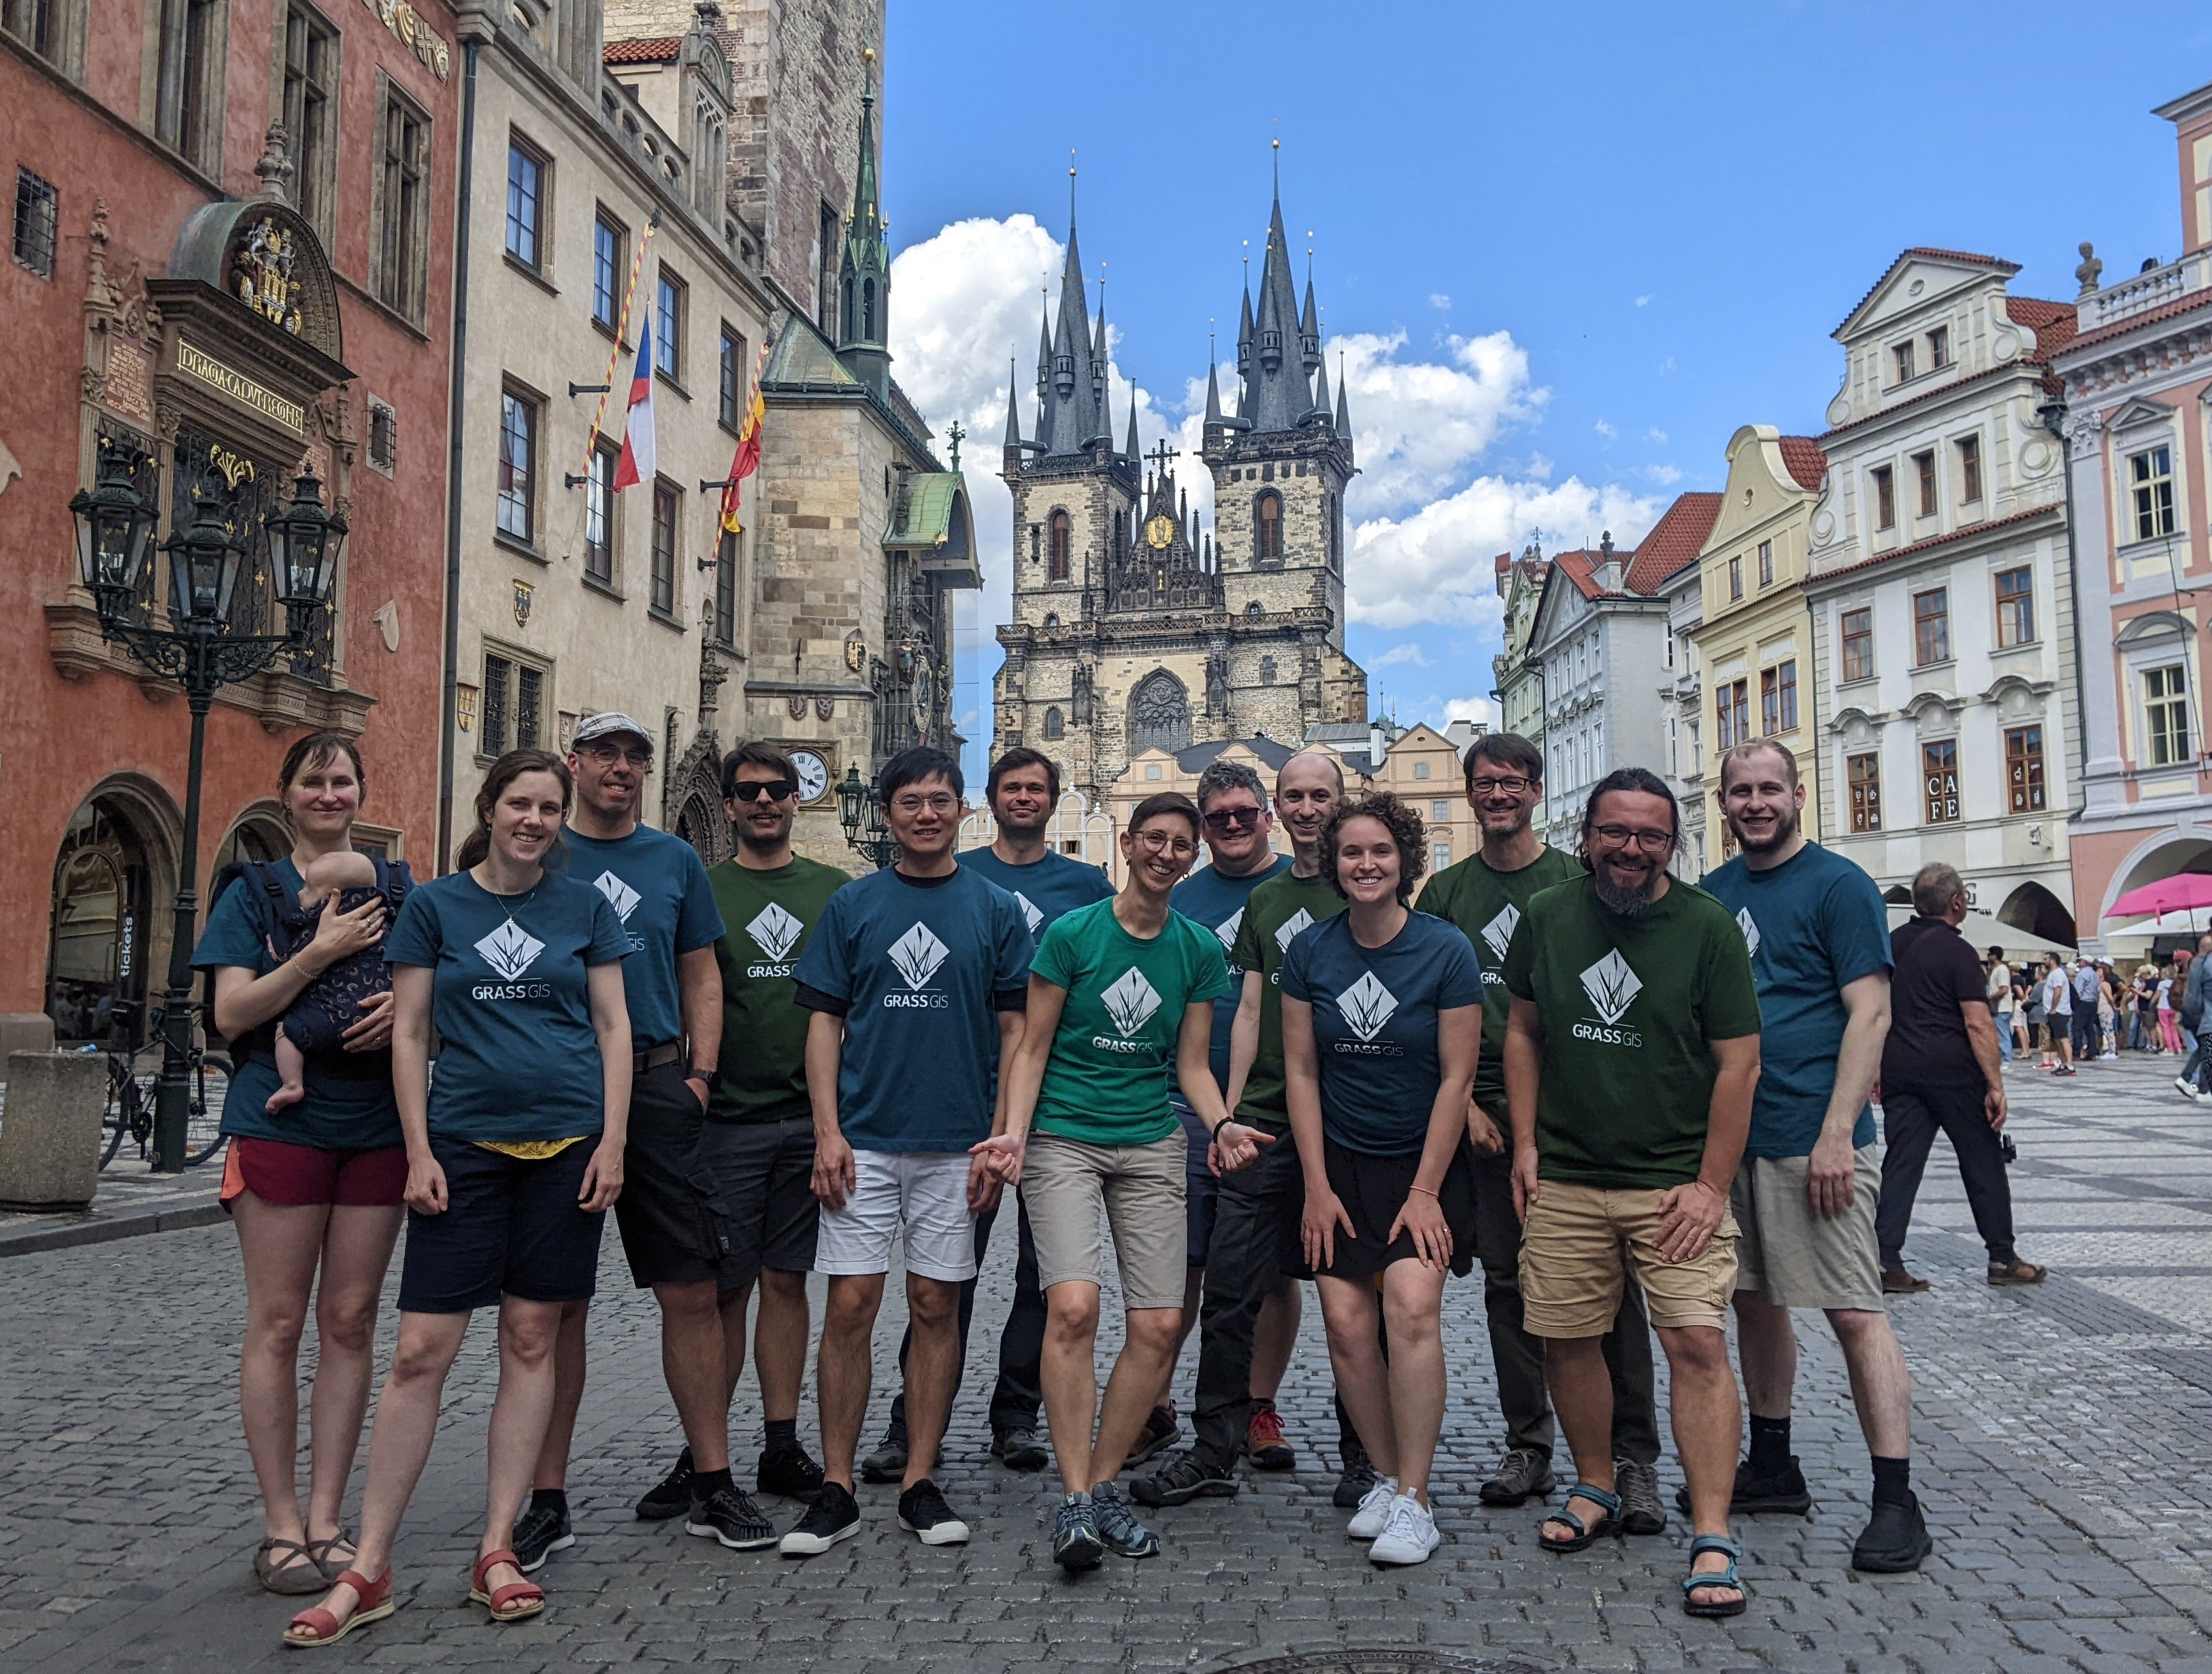 grass.osgeo.org > Latest news > Report from the GRASS Community Meeting
Funding: US NSF (Award 2303651), OSGeo, FOSSGIS, mundialis, INBO Research Institute for Nature and Forest, individual donors
grass.osgeo.org > Latest news > Report from the GRASS Community Meeting
Funding: US NSF (Award 2303651), OSGeo, FOSSGIS, mundialis, INBO Research Institute for Nature and Forest, individual donors
Join a Working Group
-
Groups:
- Geoprocessing Engine
- Open-Source Ecosystem
- Documentation and Education
- Community Engagement
- See wiki for details!
GRASS Developer Summit 2025
- Raleigh, NC
- May 19-24
- Register and become an insider: tinyurl.com/grass-2025
- Stay tuned for a user-focused event on Thursday, May 22
lead by the NC State Center for Geospatial Analytics
vpetras@ncsu.edu, LinkedIn: Vaclav Petras, @wenzeslaus
wenzeslaus.github.io/grass-talks
This talk was funded by the US National Science Foundation (NSF), award 2303651.