Publications
Peer-reviewed articles
-
Petras V., Newcomb D. J., Mitasova H, 2017. Generalized 3D fragmentation index derived from lidar point clouds. In: Open Geospatial Data, Software and Standards.
-
Rocchini, D., Petras, V., Petrasova, A., Horning, N., Furtkevicova, L., Neteler, M., Leutner, B., Wegmann, M. 2017, Open data and open source for remote sensing training in ecology. Ecological Informatics [DOI: 10.1016/j.ecoinf.2017.05.004]
-
Petrasova, A., Mitasova, H., Petras, V., Jeziorska, J. 2017. Fusion of high-resolution DEMs for water flow modeling. In: Open Geospatial Data, Software and Standards.
-

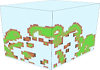
Tonini, F. Shoemaker, D., Petrasova, A., Harmon, B. A., Petras, V., Cobb, R. C., Mitasova, H., and Meentemeyer, R. K., 2017. Tangible geospatial modeling for collaborative solutions to invasive species management. In: Environmental Modelling & Software.
-
Tabrizian, P., Petrasova, A., Harmon, B. A., Petras, V., Mitasova, H., and Meentemeyer, R. K., 2016. Immersive Tangible Geospatial Modeling (demo paper). Proceedings of ACM SIGSPATIAL 2016, Burlingame, CA, USA.
-
Rocchini, D., Petras, V., Petrasova, A., Chemin, Y., Ricotta, R., Frigeri, A., Landa, M., Marcantonio, M., Bastin, L., Metz, M., Delucchi, L., Neteler, M. 2016, Spatio-ecological complexity measures in GRASS GIS. Computers & Geosciences [ScienceDirect]
Good estimates of ecosystem complexity are essential for a number of ecological tasks: from biodiversity estimation, to forest structure variable retrieval, to feature extraction by edge detection and generation of multifractal surface as neutral models for e.g. feature change assessment. Hence, measuring ecological complexity over space becomes crucial in macroecology and geography. Many geospatial tools have been advocated in spatial ecology to estimate ecosystem complexity and its changes over space and time. Among these tools, free and open source options especially offer opportunities to guarantee the robustness of algorithms and reproducibility. In this paper we will summarize the most straightforward measures of spatial complexity available in the Free and Open Source Software GRASS GIS, relating them to key ecological patterns and processes.
-
Harmon, B. A., Petrasova, A., Petras, V., and Mitasova, H., 2016, Computational Landscape Architecture: Procedural, Tangible, and Open Landscapes. In: J. R. Anderson & D. Ortega (Eds.), Innovations in Landscape Architecture. Routledge.
With emerging technologies we can begin to intuitively model and creatively design dynamic, evolving landscapes. Advances in geospatial modeling, remote sensing, rapid prototyping, and 3d scanning are changing the way that landscapes are modeled. Now we can generate dynamic landscape form with process-based scientific models. We can build precise physical models using remote sensing and rapid prototyping. And we can link physical and digital models with real-time 3d scanning. Our new technology - Tangible Landscape - enables designers to intuitively sculpt a physical model of a landscape coupled with a digital model in a real-time feedback loop of 3d scanning, geospatial modeling, and projection. This bridges the digital-analog divide by combining the embodied, kinæsthetic creativity of traditional modes of design with the analytics and procedural dynamism of geospatial modeling. Since Tangible Landscape seamlessly integrates geospatial modeling, analysis, and simulation into the design process designers can assess the performance of landscapes and quantitatively explore the impact of their designs. Tangible Landscape’s real-time analytics enable designers to rapidly iterate through design ideas while rigorously testing their ideas.
-
Jeziorska, J.; Mitasova, H.; Petrasova, A.; Petras, V.; Divakaran, D.; Zajkowski, T., 2016, Overland flow analysis using time series of sUAS-derived elevation models, ISPRS Annals.
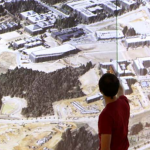
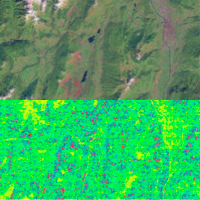
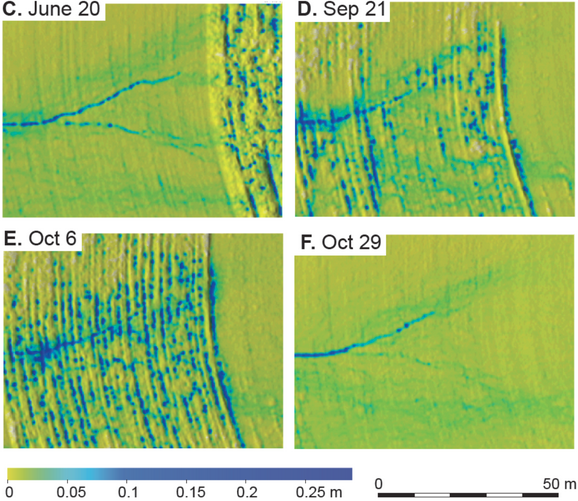
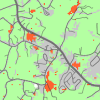
With the advent of the innovative techniques for generating high temporal and spatial resolution terrain models from Unmanned Aerial Systems (UAS) imagery, it has become possible to precisely map overland flow patterns. Furthermore, the process has become more affordable and efficient through the coupling of small UAS (sUAS) that are easily deployed with Structure from Motion (SfM) algorithms that can efficiently derive 3D data from RGB imagery captured with consumer grade cameras. We propose applying the robust overland flow algorithm based on the path sampling technique for mapping flow paths in the arable land on a small test site in Raleigh, North Carolina. By comparing a time series of five flights in 2015 with the results of a simulation based on the most recent lidar derived DEM (2013), we show that the sUAS based data is suitable for overland flow predictions and has several advantages over the lidar data. The sUAS based data captures preferential flow along tillage and more accurately represents gullies. Furthermore the simulated water flow patterns over the sUAS based terrain models are consistent throughout the year. When terrain models are reconstructed only from sUAS captured RGB imagery, however, water flow modeling is only appropriate in areas with sparse or no vegetation cover.
-
Petras, V., Mitasova, H., Petrasova, A., 2015. Mapping gradient fields of landform migration. In: Jaroslaw, J., Zwolinski, Z., Mitasova, H., Hengl, T. Geomorphometry for Geosciences. Bogucki Wydawnictwo Naukowe, Adam Mickiewicz University in Poznan – Institute of Geoecology and Geoinformation. Poznan, Poland. ISBN: 978-83-7986-059-3
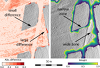
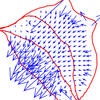
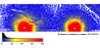
Geospatial analytics techniques describing changes of unstable landscapes provide critical information for hazard management and mitigation. We propose a method for quantifying horizontal migration of complex landforms based on the analysis of contour evolution. When applied to a set of elevations this technique provides comprehensive information on magnitude and direction of landform migration at any point in space and time. The method is based on the concept of space-time cube combined with GIS-based analysis applied to spatio-temporal surface. The result of the analysis is a vector field representing the movement and deformation of contours. We also present several approaches to visualization of these vector fields as space-time gradient lines, vectors or dynamic ”comets”. We demonstrate the method on a laboratory model and an elevation time series capturing evolution of a coastal sand dune.
-
Petras, V., Petrasova, A., Harmon, B., Meentemeyer, R.K., Mitasova, H. Integrating Free and Open Source Solutions into Geospatial Science Education. ISPRS International Journal of Geo-Information. 2015, 4, 942-956. doi:10.3390/ijgi4020942
While free and open source software becomes increasingly important in geospatial research and industry, open science perspectives are generally less reflected in universities’ educational programs. We present an example of how free and open source software can be incorporated into geospatial education to promote open and reproducible science. Since 2008 graduate students at North Carolina State University have the opportunity to take a course on geospatial modeling and analysis that is taught with both proprietary and free and open source software. In this course, students perform geospatial tasks simultaneously in the proprietary package ArcGIS and the free and open source package GRASS GIS. By ensuring that students learn to distinguish between geospatial concepts and software specifics, students become more flexible and stronger spatial thinkers when choosing solutions for their independent work in the future. We also discuss ways to continually update and improve our publicly available teaching materials for reuse by teachers, self-learners and other members of the GIS community. Only when free and open source software is fully integrated into geospatial education, we will be able to encourage a culture of openness and, thus, enable greater reproducibility in research and development applications.
-
Petras, V., Petrasova, A., Mitasova, H. FOSS4G 2014. Spatio-temporal data visualization in GRASS GIS: desktop and web solutions. [unpublished]
Online publication of geospatial data is a common requirement of GIS users. Several free and open source solutions are available. These solutions include JavaScript libraries for building web map applications as well as server-side applications for data publishing. This project aims at GIS users which don't have an option to run a server-side applications and cannot build web map applications easily. The project consists of two loosely coupled parts where one or the other can be easily replaced by some other solution. First part is a set of web map applications. Each of them is specialized to different type of data, for example one application provides tools to show spatio-temporal data. Second part is connected to GRASS GIS and consists of a set of GRASS modules which provide several ways of exporting different types of data from GRASS GIS. Besides maps, other data such as statical values about maps are also exported. Connecting exported data and web applications is as easy as putting the files into the right directory. The solution enables easy publication without any requirements on user or publication servers and is intended to be used for ad hoc data sharing with colleagues which may or may not use GIS but for sure will appreciate interactive data visualization including additional information.
-
Petrasova, A., Harmon, B., Petras, V., Mitasova, H., 2014. GIS-based environmental modeling with tangible interaction and dynamic visualization. In: Ames, D.P., Quinn, N.W.T., Rizzoli, A.E. (Eds.), Proceedings of the 7th International Congress on Environmental Modelling and Software, June 15-19, San Diego, California, USA. ISBN: 978-88-9035-744-2
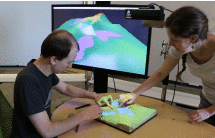
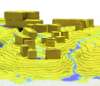
We present a new, affordable version of TanGeoMS, a tangible geospatial modeling and visualization system designed for collaboratively exploring how terrain change impacts landscape processes. It couples a physical, three-dimensional model of a landscape with geospatial modeling and analysis through a cycle of scanning and projection. Multiple users can modify the physical model by hand while it is being scanned; by sculpting the model they generate input for modeling of geophysical processes. The modeling results are then visualized by projecting images or animations back on the physical model. This feedback loop is an intuitive way to evaluate the impacts of different scenarios including anthropogenic and natural landscape change. Integration with GRASS GIS, a free and open source geographic information system, provides TanGeoMS with a variety of easily accessible geospatial analysis and modeling tools. To demonstrate the environmental modeling applications of TanGeoMS, we will demonstrate how development can be planned based on feedback from landscape processes such as hydrologic simulation and wildfire modeling with variable fuel distribution.
-
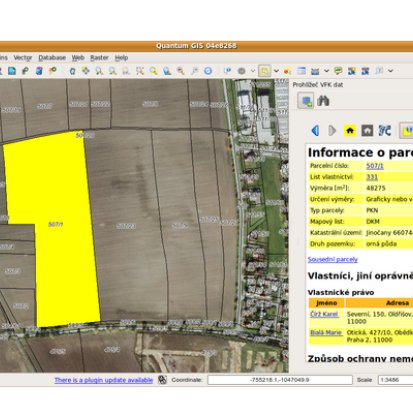
Kratochvilova, K., Petras, V., 2012. Quantum GIS plugin for Czech cadastral data. In: Geoinformatics FCE CTU, Volume 8, Prague, Czech Republic.
This paper presents new Quantum GIS plugin for Czech cadastral data and its development. QGIS is a rapidly developing cross-platform desktop Geographic Information System (GIS) released under the GNU GPL. QGIS is written in C++, and uses the Qt library. The plugin is developed in C++, too. The new plugin can work with Czech cadastral data in the new Czech cadastral exchange data format called VFK (or NVF). Data are accessed through VFK driver of the OGR library. The plugin should facilitate the work with cadastral data by easy search and presenting well arranged information. Information is displayed in the way similar to web applications, thus the control is friendly and familiar for users. The plugin supports interaction with map using QGIS functionality and it is able to export various cadastral reports. This paper provides ideas which can be generalized to develop QGIS plugin dealing with specific data.
-
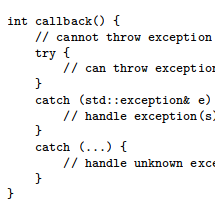
Petras, V., 2011. Implementation of SQLite database support in program gama-local. In: Geoinformatics FCE CTU, Volume 7, Prague, Czech Republic.
The program gama-local is a part of GNU Gama project and allows adjustment of local geodetic networks. Before realization of this project the program gama-local supported only XML as an input. I designed and implemented support for the SQLite database and thanks to this extension gama-local can read input data from the SQLite database. This article is focused on the specifics of the use of callback functions in C++ using the native SQLite C/C++ Application Programming Interface. The article provides solution to safe calling of callback functions written in C++. Callback functions are called from C library and C library itself is used by C++ program. Provided solution combines several programing techniques which are described in detail, so this article can serve as a cookbook even for beginner programmers. This project was accomplished within my bachelor thesis.
Papers in Conference Proceedings
-
Petras, V.; Petrasova, A.; Jeziorska, J.; Mitasova, H., 2016, Processing UAV and lidar point clouds in GRASS GIS, ISPRS Archives.
Today's methods of acquiring Earth surface data, namely lidar and unmanned aerial vehicle (UAV) imagery, non-selectively collect or generate large amounts of points. Point clouds from different sources vary in their properties such as number of returns, density, or quality. We present a set of tools with applications for different types of points clouds obtained by a lidar scanner, structure from motion technique (SfM), and a low-cost 3D scanner. To take advantage of the vertical structure of multiple return lidar point clouds, we demonstrate tools to process them using 3D raster techniques which allow, for example, the development of custom vegetation classification methods. Dense point clouds obtained from UAV imagery, often containing redundant points, can be decimated using various techniques before further processing. We implemented and compared several decimation techniques in regard to their performance and the final digital surface model (DSM). Finally, we will describe the processing of a point cloud from a low-cost 3D scanner, namely Microsoft Kinect, and its application for interaction with physical models. All the presented tools are open source and integrated in GRASS GIS, a multi-purpose open source GIS with remote sensing capabilities. The tools integrate with other open source projects, specifically Point Data Abstraction Library (PDAL), Point Cloud Library (PCL), and OpenKinect libfreenect2 library to benefit from the open source point cloud ecosystem. The implementation in GRASS GIS ensures long term maintenance and reproducibility by the scientific community but also by the original authors themselves.
-
Petrasova, A., Petras, V., Van Berkel, D., Harmon, B. A., Mitasova, H., Meentemeyer, R. K., 2016, Open source approach to urban growth simulation, ISPRS Archives.
Many valuable models and tools developed by scientists are often inaccessible to their potential users because of non-existent sharing infrastructure or lack of documentation. Case in point is the FUTure Urban-Regional Environment Simulation (FUTURES), a patch-based land change model for generating scenario-based regional forecasts of urban growth pattern. Despite a high-impact publication, few scientists, planners, or policy makers have adopted FUTURES due to complexity in use and lack of direct access. We seek to address these issues by integrating FUTURES into GRASS GIS, a free and open source GIS and research platform for geospatial domain. This integration will enable us to take advantage of GRASS GIS tools for landscape structure analysis, and thus eliminate the need to use proprietary software for data preprocessing. Moreover, integration into GRASS GIS simplifies the distribution of FUTURES across all main operating systems and ensures maintainability of our project in the future. We will present our use case of integrating this advanced land change model into GRASS GIS platform and discuss the current state of the integration as well as the planned steps to achieve our vision of simple-to-use and fully free and open source FUTURES.
-

Harmon, B. A., Petrasova, A., Petras, V., Mitasova, H., Meentemeyer, R. K., 2016, Spatial cognition in tangible computing, ISPRS Archives.
-
Petrasova, A., Petras, V., Shoemaker, D. A., Dorning, M. A., and Meentemeyer, R. K., 2015, The integration of land change modeling framework FUTURES into GRASS GIS 7, Geomatics Workbooks n° 12 - FOSS4G Europe: Como 2015.
Books
-
Tangible Modeling with Open Source GIS
Petrasova, A., Harmon, B., Petras, V., Mitasova, H., 2015. Tangible Modeling with Open Source GIS. Springer International Publishing. doi:10.1007/978-3-319-25775-4
This book presents a new type of modeling environment where users interact with geospatial simulations using 3D physical models of studied landscapes. Multiple users can alter the physical model by hand during scanning, thereby providing input for simulation of geophysical processes in this setting. The authors have developed innovative techniques and software that couple this hardware with open source GRASS GIS, making the system instantly applicable to a wide range of modeling and design problems. Since no other literature on this topic is available, this book fills a gap for this new technology that continues to grow. Tangible Modeling with Open Source GIS will appeal to advanced-level students studying geospatial science, computer science and earth science such as landscape architecture and natural resources. It will also benefit researchers and professionals working in geospatial modeling applications, computer graphics, hazard risk management, hydrology, solar energy, coastal and fluvial flooding, fire spread, landscape, park design and computer games.
Theses and Dissertations
-
Doctoral dissertation: Geospatial Analytics for Point Clouds in an Open Science Framework
Point clouds acquired by lidar (Light Detection and Ranging) or created from UAS (Unmanned Aerial Systems) imagery have transformed how the Earth’s surface and vegetation structure are mapped and analyzed. These point clouds have such high numbers of points that they are often considered “big data” depending on one’s field, software and hardware resources. As part of my dissertation, I developed several methods to efficiently analyze data-rich point clouds for creating digital terrain models and characterizing vegetation structure. I also created a method to describe complex migration of landforms using time-series data, quantifying the magnitude and direction of landform change. To ensure that these geospatial methods and algorithms are available to a wide audience, I also proposed a methodology which describes how to share research components in a reproducible and reusable manner. With this methodology, tools and methods created as part of research can be used not only by other scientists but also by non-academic professionals in the geospatial field.
(Library record, Defense slides)
Supervised by prof. Helena Mitasova, Ph.D.
Committee (additional advisors): James McCarter, Ross Meentemeyer, Laura Tateosian
-
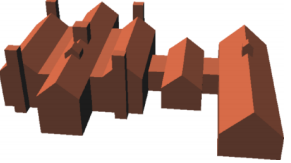
Master’s thesis: Building detection from aerial images in GRASS GIS environment
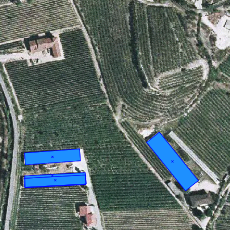
Despite the current availability of various geographic data, building detection is still needed under some circumstances. These circumstances can include inaccessibility of cadastral data, unrecorded and illegal building detection and disaster mapping. A number of approaches has been developed to detect buildings which rely on different kinds of spatial and quality features such as shape or color in remotely sensed imagery. The key properties differ among the various types of buildings (family house, factory, animal farm) and areas (city, rural area, state or country). This often requires the development of specialized detection algorithms. This work presents an algorithm developed to detect animal farm buildings in northern Italy. However, this implementation is intended to address not only the detection of farm buildings but to provide general tools for building detection in GRASS GIS. This work presents the implementation of an edge detector, line segment extractor and classification tool as well as the detection made on northern Italy orthophotos. All tools were implemented in the environment of the free and open source GIS software GRASS GIS. The use of free and open source software ensures that source code can be peer-reviewed and the analysis is highly reproducible.
Supervised by Ing. Ivana Hlaváčová, Ph.D.
-
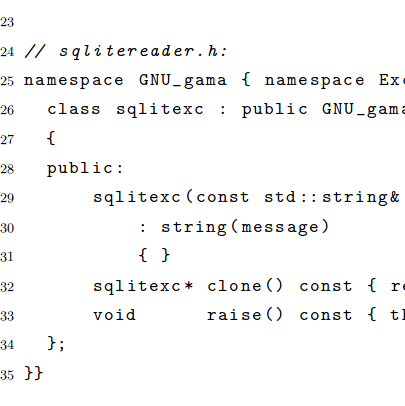
Bachelor's thesis: Support of SQLite database in program gama-local
The program gama-local is a part of GNU Gama project and allows adjustment of local geodetic networks. The aim of this bachelor thesis is to design and implement support for the SQLite database in the program gama-local. Currently, the program gama-local supports only XML as an input. Thanks to this thesis program can read input data from the SQLite database. The thesis deals with the specifics of the use of callback functions in C++ using the native SQLite C/C++ Application Programming Interface. Tests of newly developed version of gama-local are also part of this thesis.
Supervised by prof. Ing. Aleš Čepek, CSc.
Posters
-
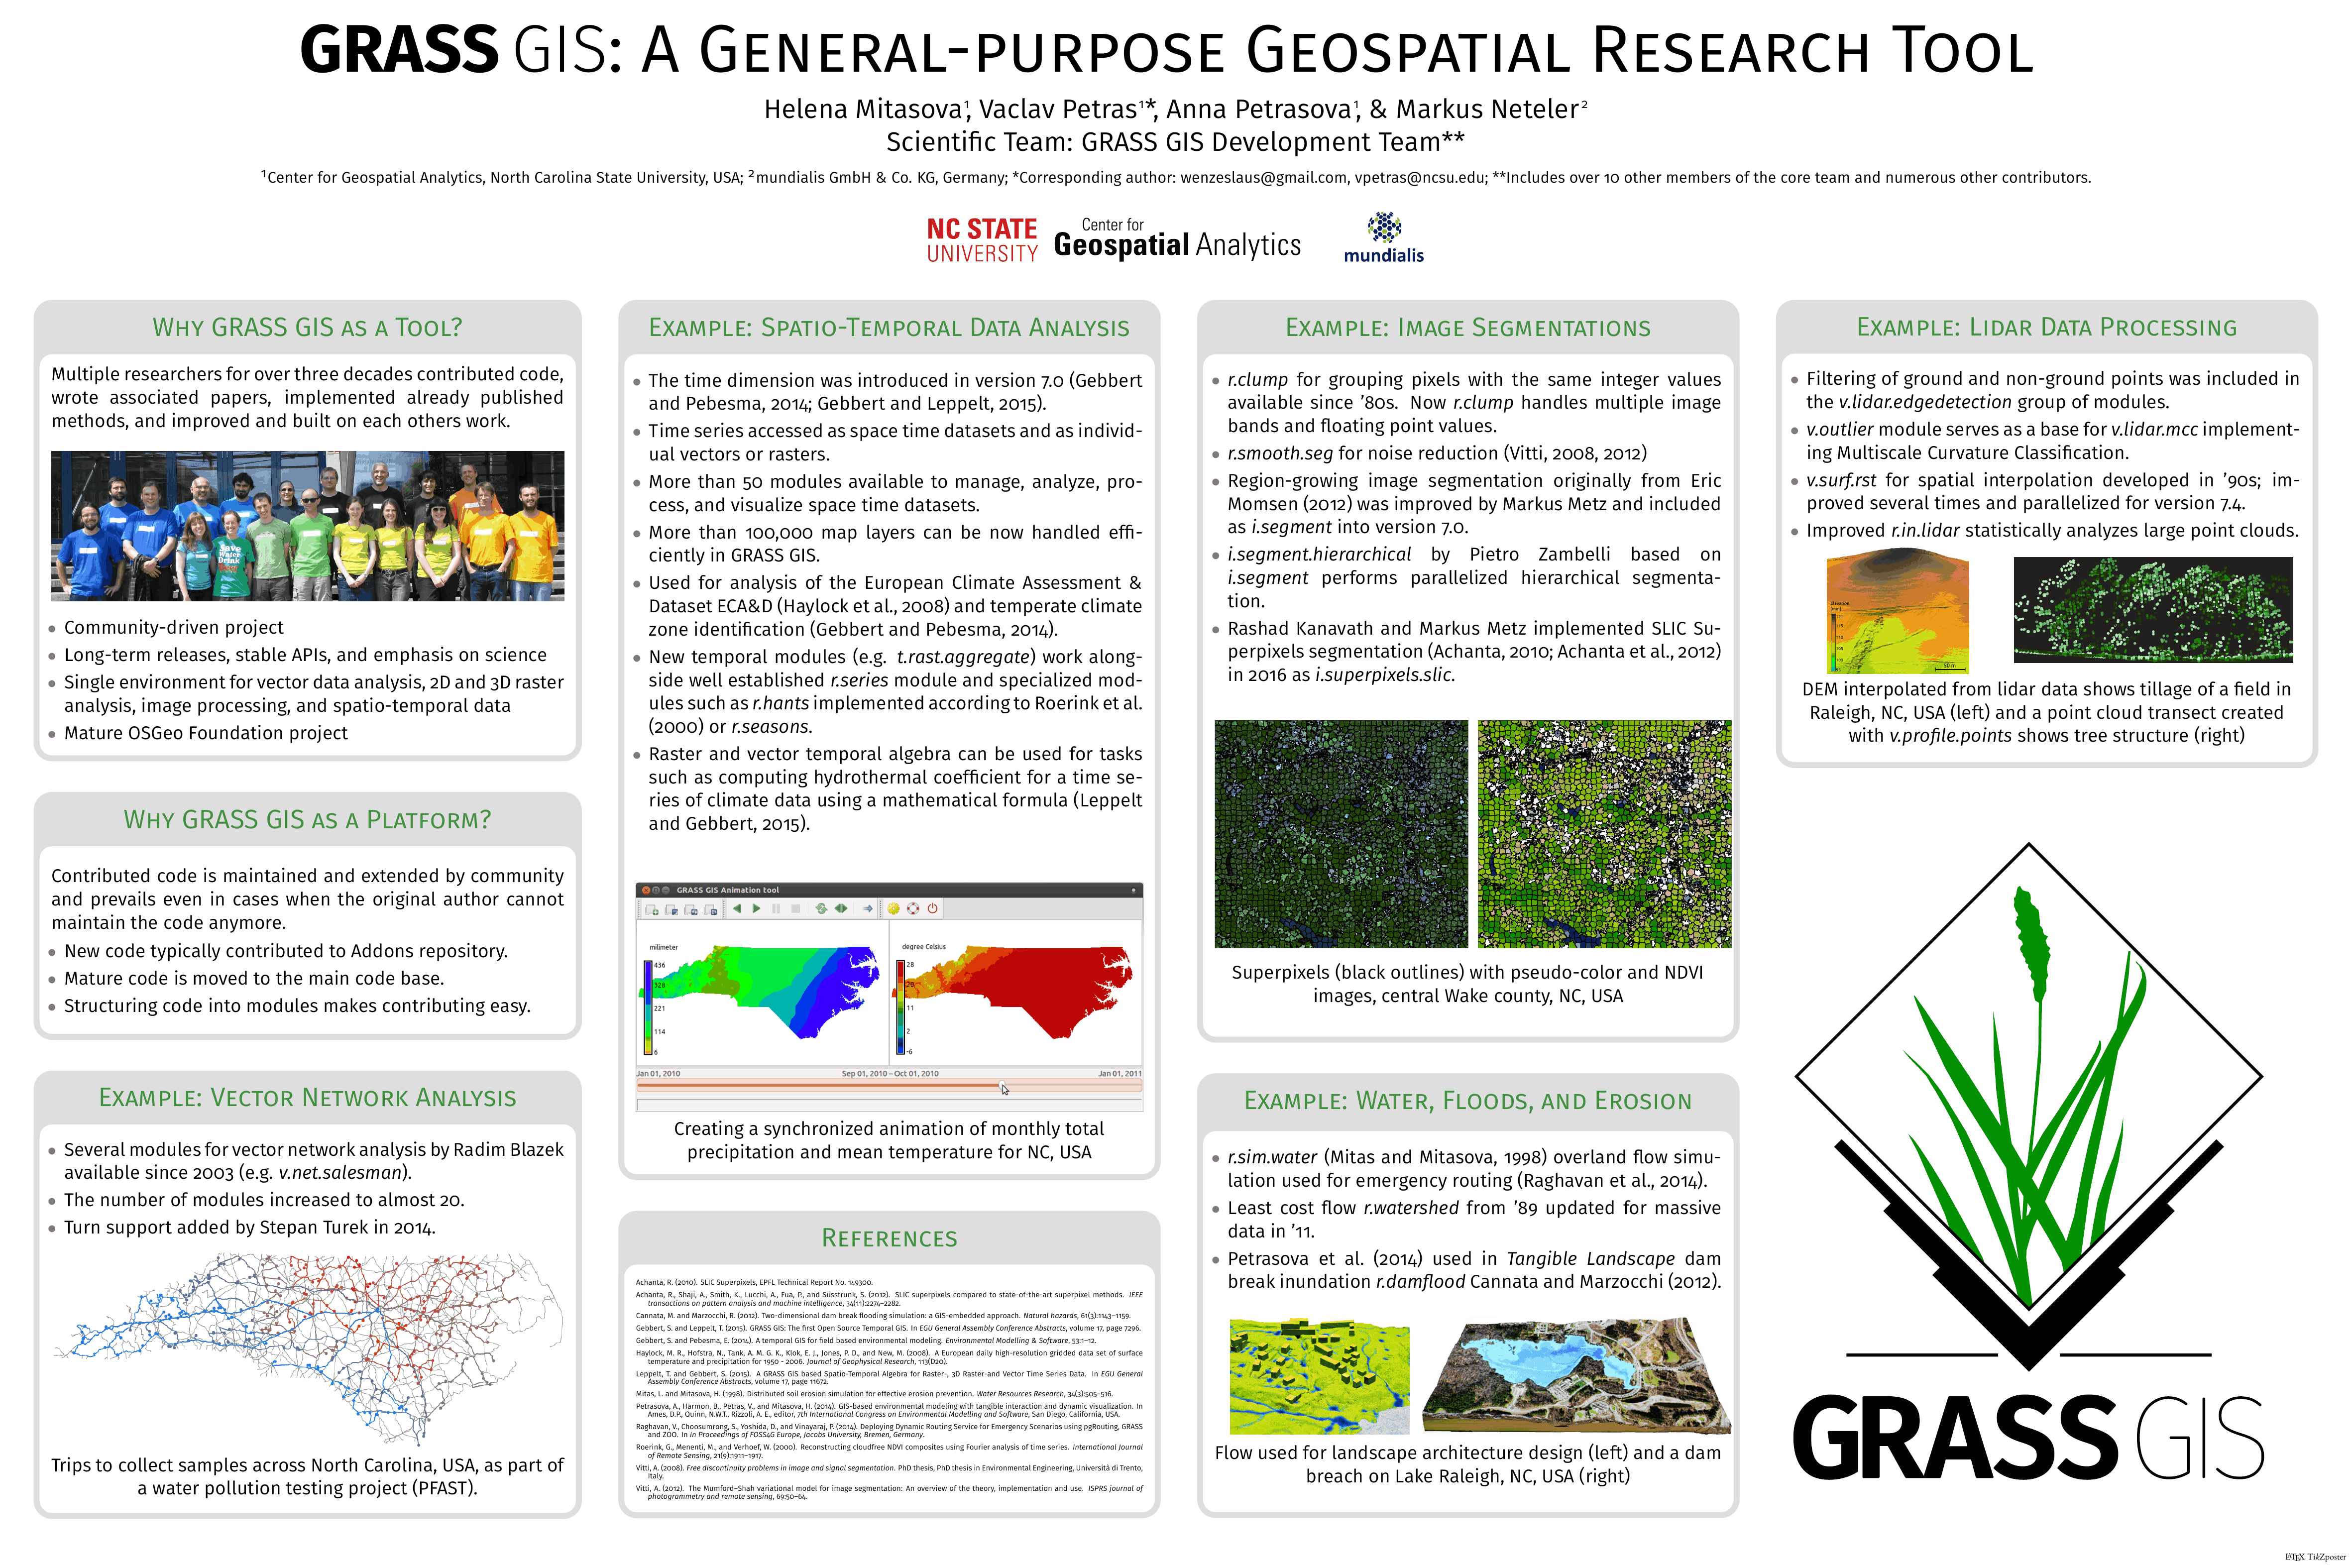
GRASS GIS: A General-purpose Geospatial Research Tool
Mitasova, H., Petras, V., Petrasova, A., Neteler, M. GRASS GIS: A General-purpose Geospatial Research Tool. Fall Meeting of American Geophysical Union (2018), Washington, D.C., USA, December 10-14, 2018 (poster and talk, Poster as PDF, Slides as PDF)
GRASS GIS (grass.osgeo.org) is an open source software for geospatial analysis, remote sensing, general geoprocessing and visualization. It is a community-driven project with over 35 years of continuous software development based on scientific expertise from many geospatial fields. It is characterized by long-term releases, stable APIs, and emphasis on science. GRASS GIS distribution strives to provide single integrated environment for 2D and 3D raster analysis, image processing, vector data analysis, and spatio-temporal data processing. It supports large raster files (billions of cells), vector topology, coupling with databases, and 64 bit memory. New code based on recent research is typically contributed to GRASS GIS Addons repository. Mature, widely used code is then moved to the main code base to maximize integration and availability. Whether it is addons or the main code base, code is usually maintained by the community and preserved in long term even in cases when the original author no longer supports the code. To support the needs of scientists, the documentation includes not only links to the source code, its history, and its authors, but also links to research papers that describe the algorithms implemented in the modules.
Code is not only maintained but also extended and improved. For example, watershed and stream extraction using least cost path approach was implemented in 1989 and extended for massive datasets in 2011. Similarly, vector topology cleaning was introduced in 2002, updated over time and substantially improved in 2016. Another example is a solar energy module available since 1993 and parallelized in 2017. The current stable version of GRASS GIS 7.4 provides new features for geosciences such as temporal framework with temporal algebra for large time-series processing, fusion of elevation models from various sensors, 3D flows, landform detection, image segmentation, simplified batch processing, and integrated Python editor among others. GRASS GIS runs in various environments including Linux, Mac, Windows, Docker, Raspberry Pi, and on HPC clusters. The modules are written in Python, C, or C++. Besides command line interface, GRASS GIS provides a graphical user interface, a Python API, and a C API. Interfaces with other languages such as R and Ruby are supplied by collaborating communities. -
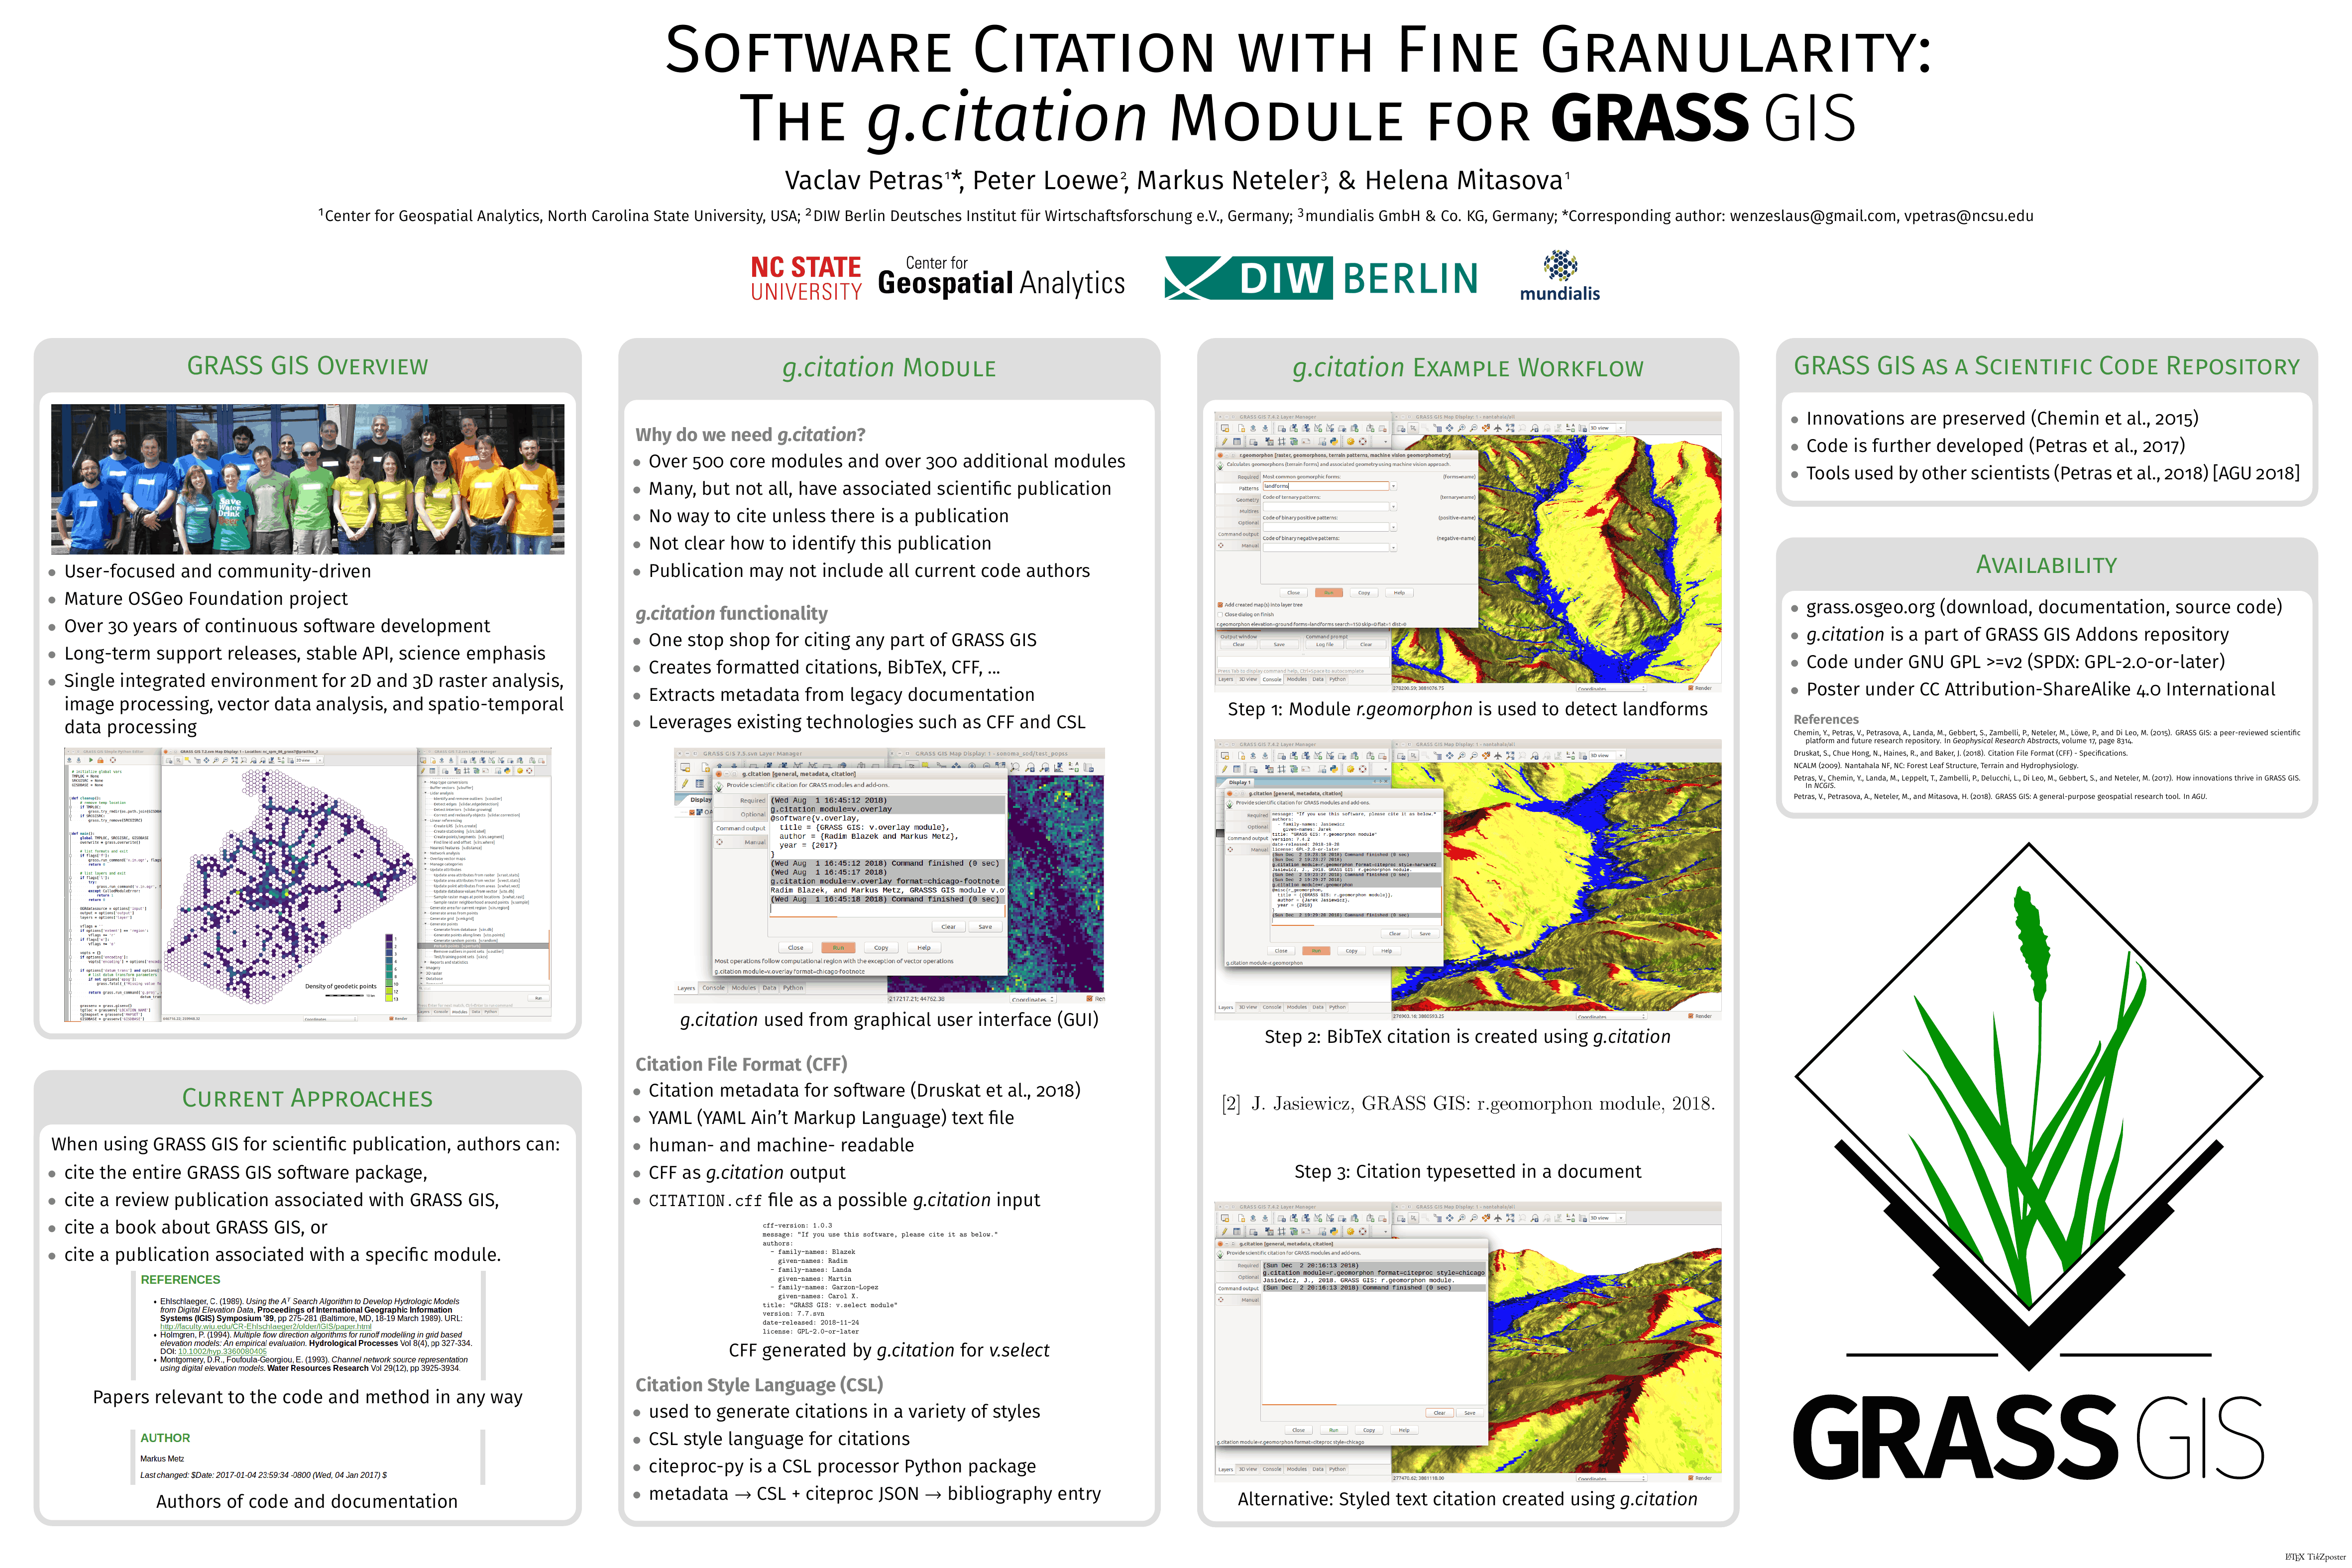
Software Citation with Fine Granularity: The g.citation Module for GRASS GIS
Petras, V., Loewe, P., Neteler, M. Software Citation with Fine Granularity: The g.citation Module for GRASS GIS. Fall Meeting of American Geophysical Union (2018), Washington, D.C., USA, December 10-14, 2018 (Poster as PDF)
GRASS GIS (grass.osgeo.org) is a community-driven geospatial software project with a record of being used in scientific publications and research projects over three decades. Authors of scientific publications, when using and citing GRASS GIS, so far opted for citing either the entire software package, citing the most recent review publication associated with GRASS GIS, or citing a publication associated with a specific module.
GRASS GIS provides over 500 modules, each with a unique functionality and purpose, many with associated scientific publications. In addition to these core modules in the GRASS GIS distribution there is a growing number of additional add-on modules are being developed, often as part of research work. Until now, no automated, software-enabled citation mechanism to cite individual GRASS GIS modules, or functions in general was provided due to the lack of a reference citation standard for GRASS GIS modules defined within the GRASS GIS community.
We present a new GRASS GIS module g.citation with the aim to provide a convenient, concise, and standardized way of citing GRASS GIS and its individual modules. The current version of g.citation extracts the relevant information from a respective manual page of any given GRASS GIS module and turns this semi-structured record into a proper citation in a variety of styles and formats with the machine-readable Citation File Format (CFF) currently promising most efficiency and expressiveness in storing the information and Citation Style Language (CSL) used for formatting citations. The module is now in a prototype stage and it is available in the GRASS GIS Addons repository. Future directions include using standardized format for storing the citation information together with the code and incorporating persistent scientific identifiers such as DOI. We are now seeking collaborators and feedback from authors of geospatial algorithms who want to share their code and be cited at the same time. -
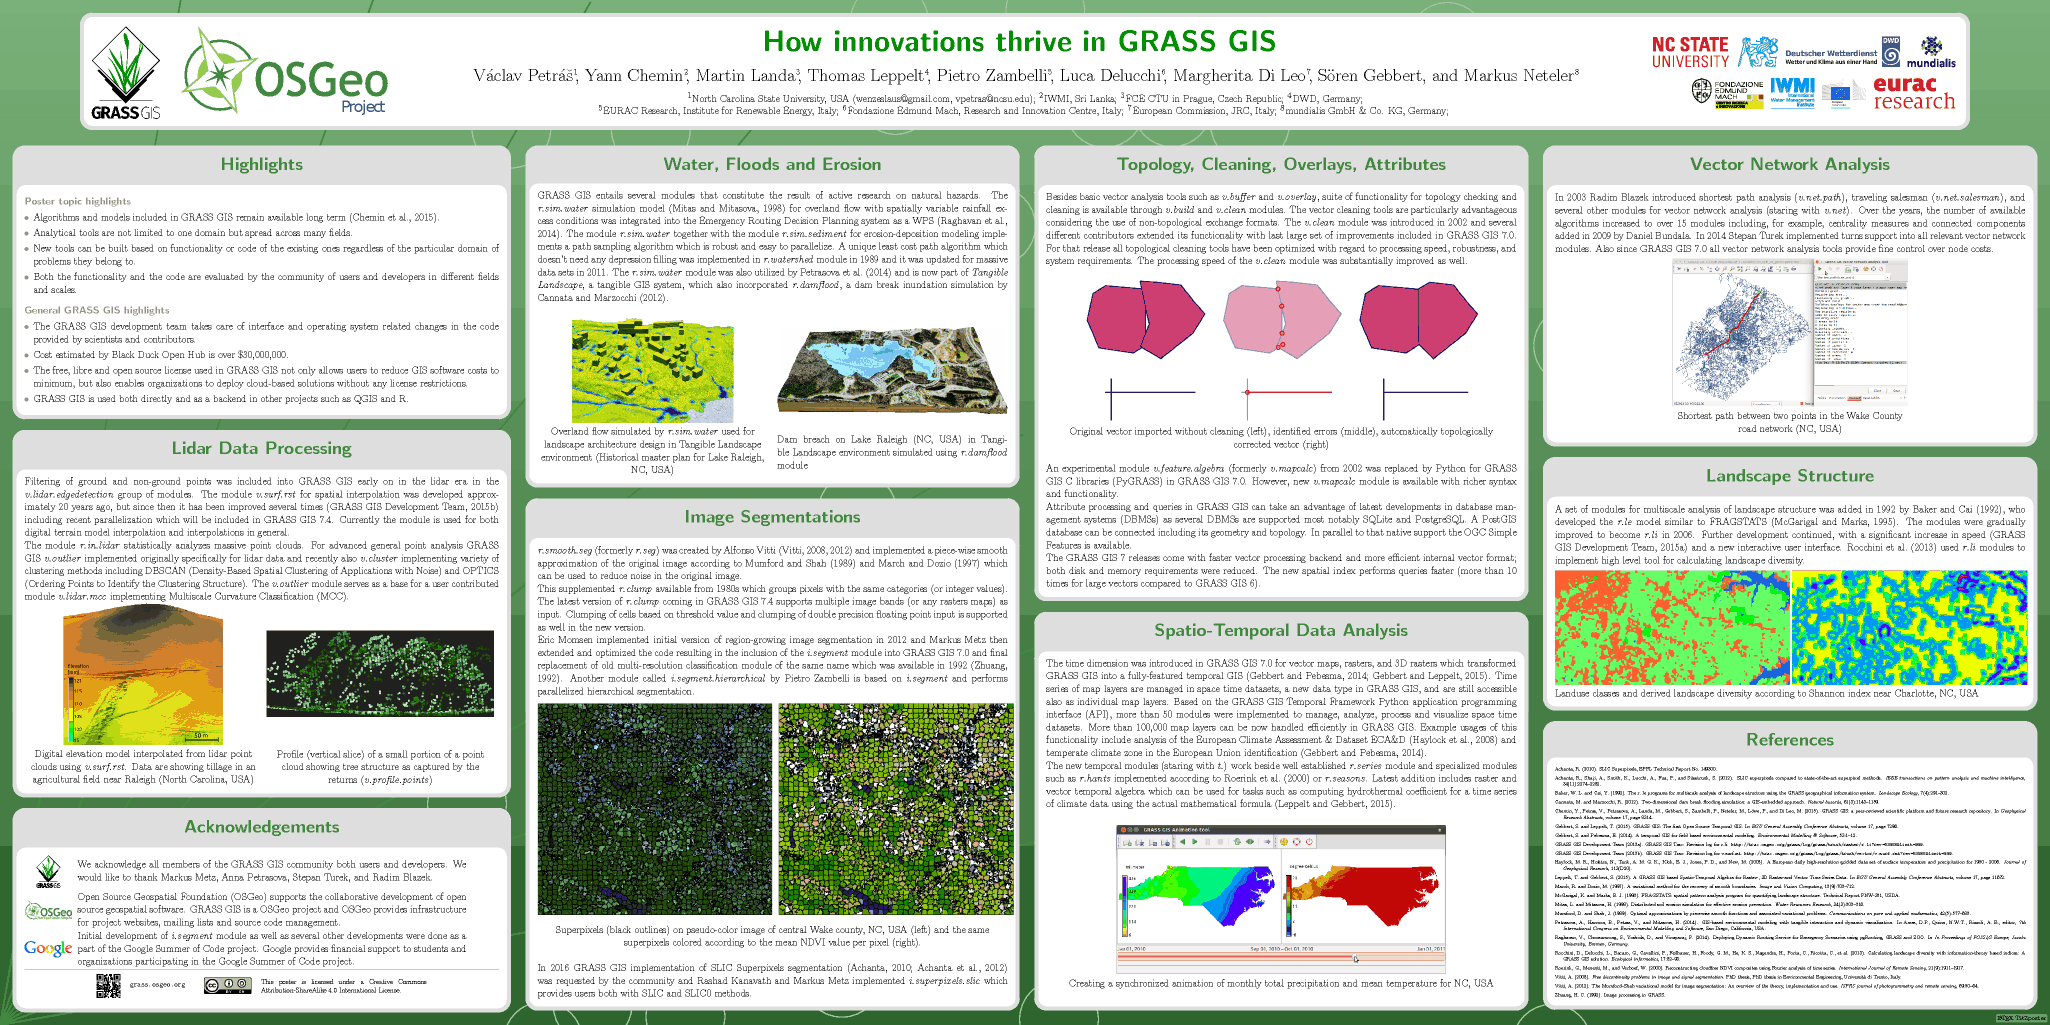
How innovations thrive in GRASS GIS
Vaclav Petras, Yann Chemin, Martin Landa, Thomas Leppelt, Pietro Zambelli, Luca Delucchi, Margherita Di Leo, Sören Gebbert, and Markus Neteler. How innovations thrive in GRASS GIS. NCGIS2017 Raleigh, NC, USA, Feb. 22-24, 2017. (full quality PDF, speed-optimized raster image)
Highlights: Algorithms and models included in GRASS GIS remain available long term. Analytical tools are not limited to one domain but spread across many fields. New tools can be built based on functionality or code of the existing ones regardless of the particular domain of problems they belong to. Both the functionality and the code are evaluated by the community of users and developers in different fields and scales. Outline: Lidar Data Processing, Water, Floods and Erosion, Image Segmentations, Topology, Cleaning, Overlays, Attributes, Spatio-Temporal Data Analysis, Vector Network Analysis, Landscape Structure
-
Analyzing rasters, vectors and time series using new Python interfaces in GRASS GIS 7
Petras, V., Petrasova, A., Chemin, Y., Zambelli, P., Landa, M., Gebbert, S., Neteler, M., Loewe, P. EGU 2015. Analyzing rasters, vectors and time series using new Python interfaces in GRASS GIS 7. (abstract, PDF)
GRASS GIS 7 is a free and open source GIS software developed and used by many scientists (Neteler et al., 2012). While some users of GRASS GIS prefer its graphical user interface, significant part of the scientific community takes advantage of various scripting and programing interfaces offered by GRASS GIS to develop new models and algorithms. Here we will present different interfaces added to GRASS GIS 7 and available in Python, a popular programming language and environment in geosciences. These Python interfaces are designed to satisfy the needs of scientists and programmers under various circumstances. PyGRASS (Zambelli et al., 2013) is a new object-oriented interface to GRASS GIS modules and libraries. The GRASS GIS libraries are implemented in C to ensure maximum performance and the PyGRASS interface provides an intuitive, pythonic access to their functionality. GRASS GIS Python scripting library is another way of accessing GRASS GIS modules. It combines the simplicity of Bash and the efficiency of the Python syntax. When full access to all low-level and advanced functions and structures from GRASS GIS library is required, Python programmers can use an interface based on the Python ctypes package. Ctypes interface provides complete, direct access to all functionality as it would be available to C programmers. GRASS GIS provides specialized Python library for managing and analyzing spatio-temporal data (Gebbert and Pebesma, 2014). The temporal library introduces space time datasets representing time series of raster, 3D raster or vector maps and allows users to combine various spatio-temporal operations including queries, aggregation, sampling or the analysis of spatio-temporal topology. We will also discuss the advantages of implementing scientific algorithm as a GRASS GIS module and we will show how to write such module in Python. To facilitate the development of the module, GRASS GIS provides a Python library for testing (Petras and Gebbert, 2014) which helps researchers to ensure the robustness of the algorithm, correctness of the results in edge cases as well as the detection of changes in results due to new development. For all modules GRASS GIS automatically creates standardized command line and graphical user interfaces and documentation. Finally, we will show how GRASS GIS can be used together with powerful Python tools such as the NumPy package and the IPython Notebook.
-
GRASS GIS: a peer-reviewed scientific platform and future research repository
Chemin, Y., Petras, V., Petrasova, A., Landa, M., Gebbert, S., Zambelli, P., Markus Neteler (6), Peter Loewe, Di Leo, M. EGU 2015. GRASS GIS: a peer-reviewed scientific platform and future research repository. (abstract, PDF)
Geographical Information System (GIS) is known for its capacity to spatially enhance the management of natural resources. While being often used as an analytical tool, it also represents a collaborative scientific platform to develop new algorithms. Thus, it is critical that GIS software as well as the algorithms are open and accessible to anybody. We present how GRASS GIS, a free and open source GIS, is used by many scientists to implement and perform geoprocessing tasks. We will show how integrating scientific algorithms into GRASS GIS helps to preserve reproducibility of scientific results over time. Moreover, subsequent improvements are tracked in the source code version control system and are immediately available to the public. GRASS GIS therefore acts as a repository of scientific peer-reviewed code, algorithm library, and knowledge hub for future generation of scientists. In the field of hydrology, with the various types of actual evapotranspiration (ET) models being developed in the last 20 years, it becomes necessary to inter-compare methods. Most of already published ETa models comparisons address few number of models, and small to medium areas. With the large amount of remote sensing data covering the Earth, and the daily information available for the past ten years (i.e. Aqua/Terra-MODIS) for each pixel location, it becomes paramount to have a more complete comparison, in space and time. To address this new experimental requirement, a distributed computing framework was designed, and created. The design architecture was built from original satellite datasets to various levels of processing until reaching the requirement of various ETa models input dataset. Each input product is computed once and reused in all ETa models requiring such input. This permits standardization of inputs as much as possible to zero-in variations of models to the models internals/specificities. All of the ET models are available in the new GRASS GIS version 7 as imagery modules and replicability is complete for future research. A set of modules for multiscale analysis of landscape structure was added in 1992 by Baker, who developed the r.le model similar to FRAGSTATS. The modules were gradually improved to become r.li in 2006. Further development continued, with a significant speed up and new interactive user interface. The development of spatial interpolation module v.surf.rst started in 1988 and continued by introduction of new interpolation methods and finally full integration into GRASS GIS version 4. Since then it was improved several times. The module is an important part of GRASS GIS and is taught at geospatial modeling courses, for example at North Carolina State University. GRASS GIS entails several modules that constitute the result of active research on natural hazard. The r.sim.water simulation model for overland flow under rainfall excess conditions was integrated into the Emergency Routing Decision Planning system as a WPS. It was also utilized by Petrasova and is now part of Tangible Landscape, a tangible GIS system, which also incorporated the r.damflood, a dam break inundation simulation. The wildfire simulation toolset, originally developed by Xu, implementing Rothermel’s model, available through the GRASS GIS modules r.ros and r.spread, is object of active research. It has been extensively tested and recently adapted to European fuel types.
-

Testing framework for GRASS GIS: ensuring reproducibility of scientific geospatial computing
Petras, V., Gebbert, S. Testing framework for GRASS GIS: ensuring reproducibility of scientific geospatial computing. AGU 2014. [ePoster and abstract in program]
GRASS GIS, a free and open source GIS, is used by many scientists directly or through other projects such as R or QGIS to perform geoprocessing tasks. Thus, a large number of scientific geospatial computations depend on quality and correct functionality of GRASS GIS. Automatic functionality testing is therefore necessary to ensure software reliability. Here we present a testing framework for GRASS GIS which addresses different needs of GRASS GIS and geospatial software in general. It allows to test GRASS tools (referred to as GRASS modules) and examine outputs including large raster and vector maps as well as temporal datasets. Furthermore, it enables to test all levels of GRASS GIS architecture including C and Python application programming interface and GRASS modules invoked as subprocesses. Since GRASS GIS is used as a platform for development of geospatial algorithms and models, the testing framework allows not only to test GRASS GIS core functionality but also tools developed by scientists as a part of their research. Using testing framework we can test GRASS GIS and related tools automatically and repetitively and thus detect errors caused by code changes and new developments. Tools and code are then easier to maintain which results in preserving reproducibility of scientific results over time. Similarly to open source code, the test results are publicly accessible, so that all current and potential users can see them. The usage of testing framework will be presented on an example of a test suite for r.slope.aspect module, a tool for computation of terrain slope, aspect, curvatures and other terrain characteristics.
-
GRASS GIS Vector State of the Art — Gearing towards GRASS GIS 7
Metz, M., Landa, M., Petrasova, A., Petras, V., Chemin, Y., Neteler, M. and The GRASS GIS Development Team. GRASS GIS Vector State of the Art — Gearing towards GRASS GIS 7. EGU 2014. [PDF]
Topology ensures that adjacent geographic components in a single vector map are related. In contrast to non-topological GIS, a border common to two areas exists only once and is shared between the two areas. Topological representation of vector data helps to produce and maintain vector maps with clean geometry as well as enables the user to perform certain analyses that can not be conducted with non-topological or spaghetti data. Non-topological vector data are automatically converted to a topological representation upon import. Further more, various cleaning tools exist to remove non-trivial topological errors. In the upcoming GRASS GIS 7 release the vector library was particularly improved to make it faster and more efficient with an improved internal vector file format. This new topological format reduces memory and disk space requirements, leading to a generally faster processing. Opening an existing vector requires less memory providing additionally support for large files. The new spatial index performs queries faster (compared to GRASS GIS 6 more than 10 times for large vectors). As a new option the user can select a file-based version of the spatial index for large vector data. All topological cleaning tools have been optimized with regard to processing speed, robustness, and system requirements. The vector engine comes with a new prototype for direct read/write support of OGR Simple Features API. Additionally vector data can be directly exchanged with topological PostGIS 2 databases. This enables GRASS to read and write topological primitives beside native file-based format also to the topological PostGIS 2 databases. Considering the wide spread usage of Esri Shapefile, a non-topological format for vector data exchange, it is particularly advantageous that GRASS GIS 7 offers advanced cleaning tools. For power users and programmers, the new Python interface allows to directly access functions provided by the underlying C libraries; this combines the ease of writing Python scripts with the power of optimized C functionality in the library backend.